- Industry
- Crypto/FinTech
- Role
- Product Designer
- Year
- 2021
- Industry
- Crypto/FinTech
- Role
- Product Designer
- Year
- 2021
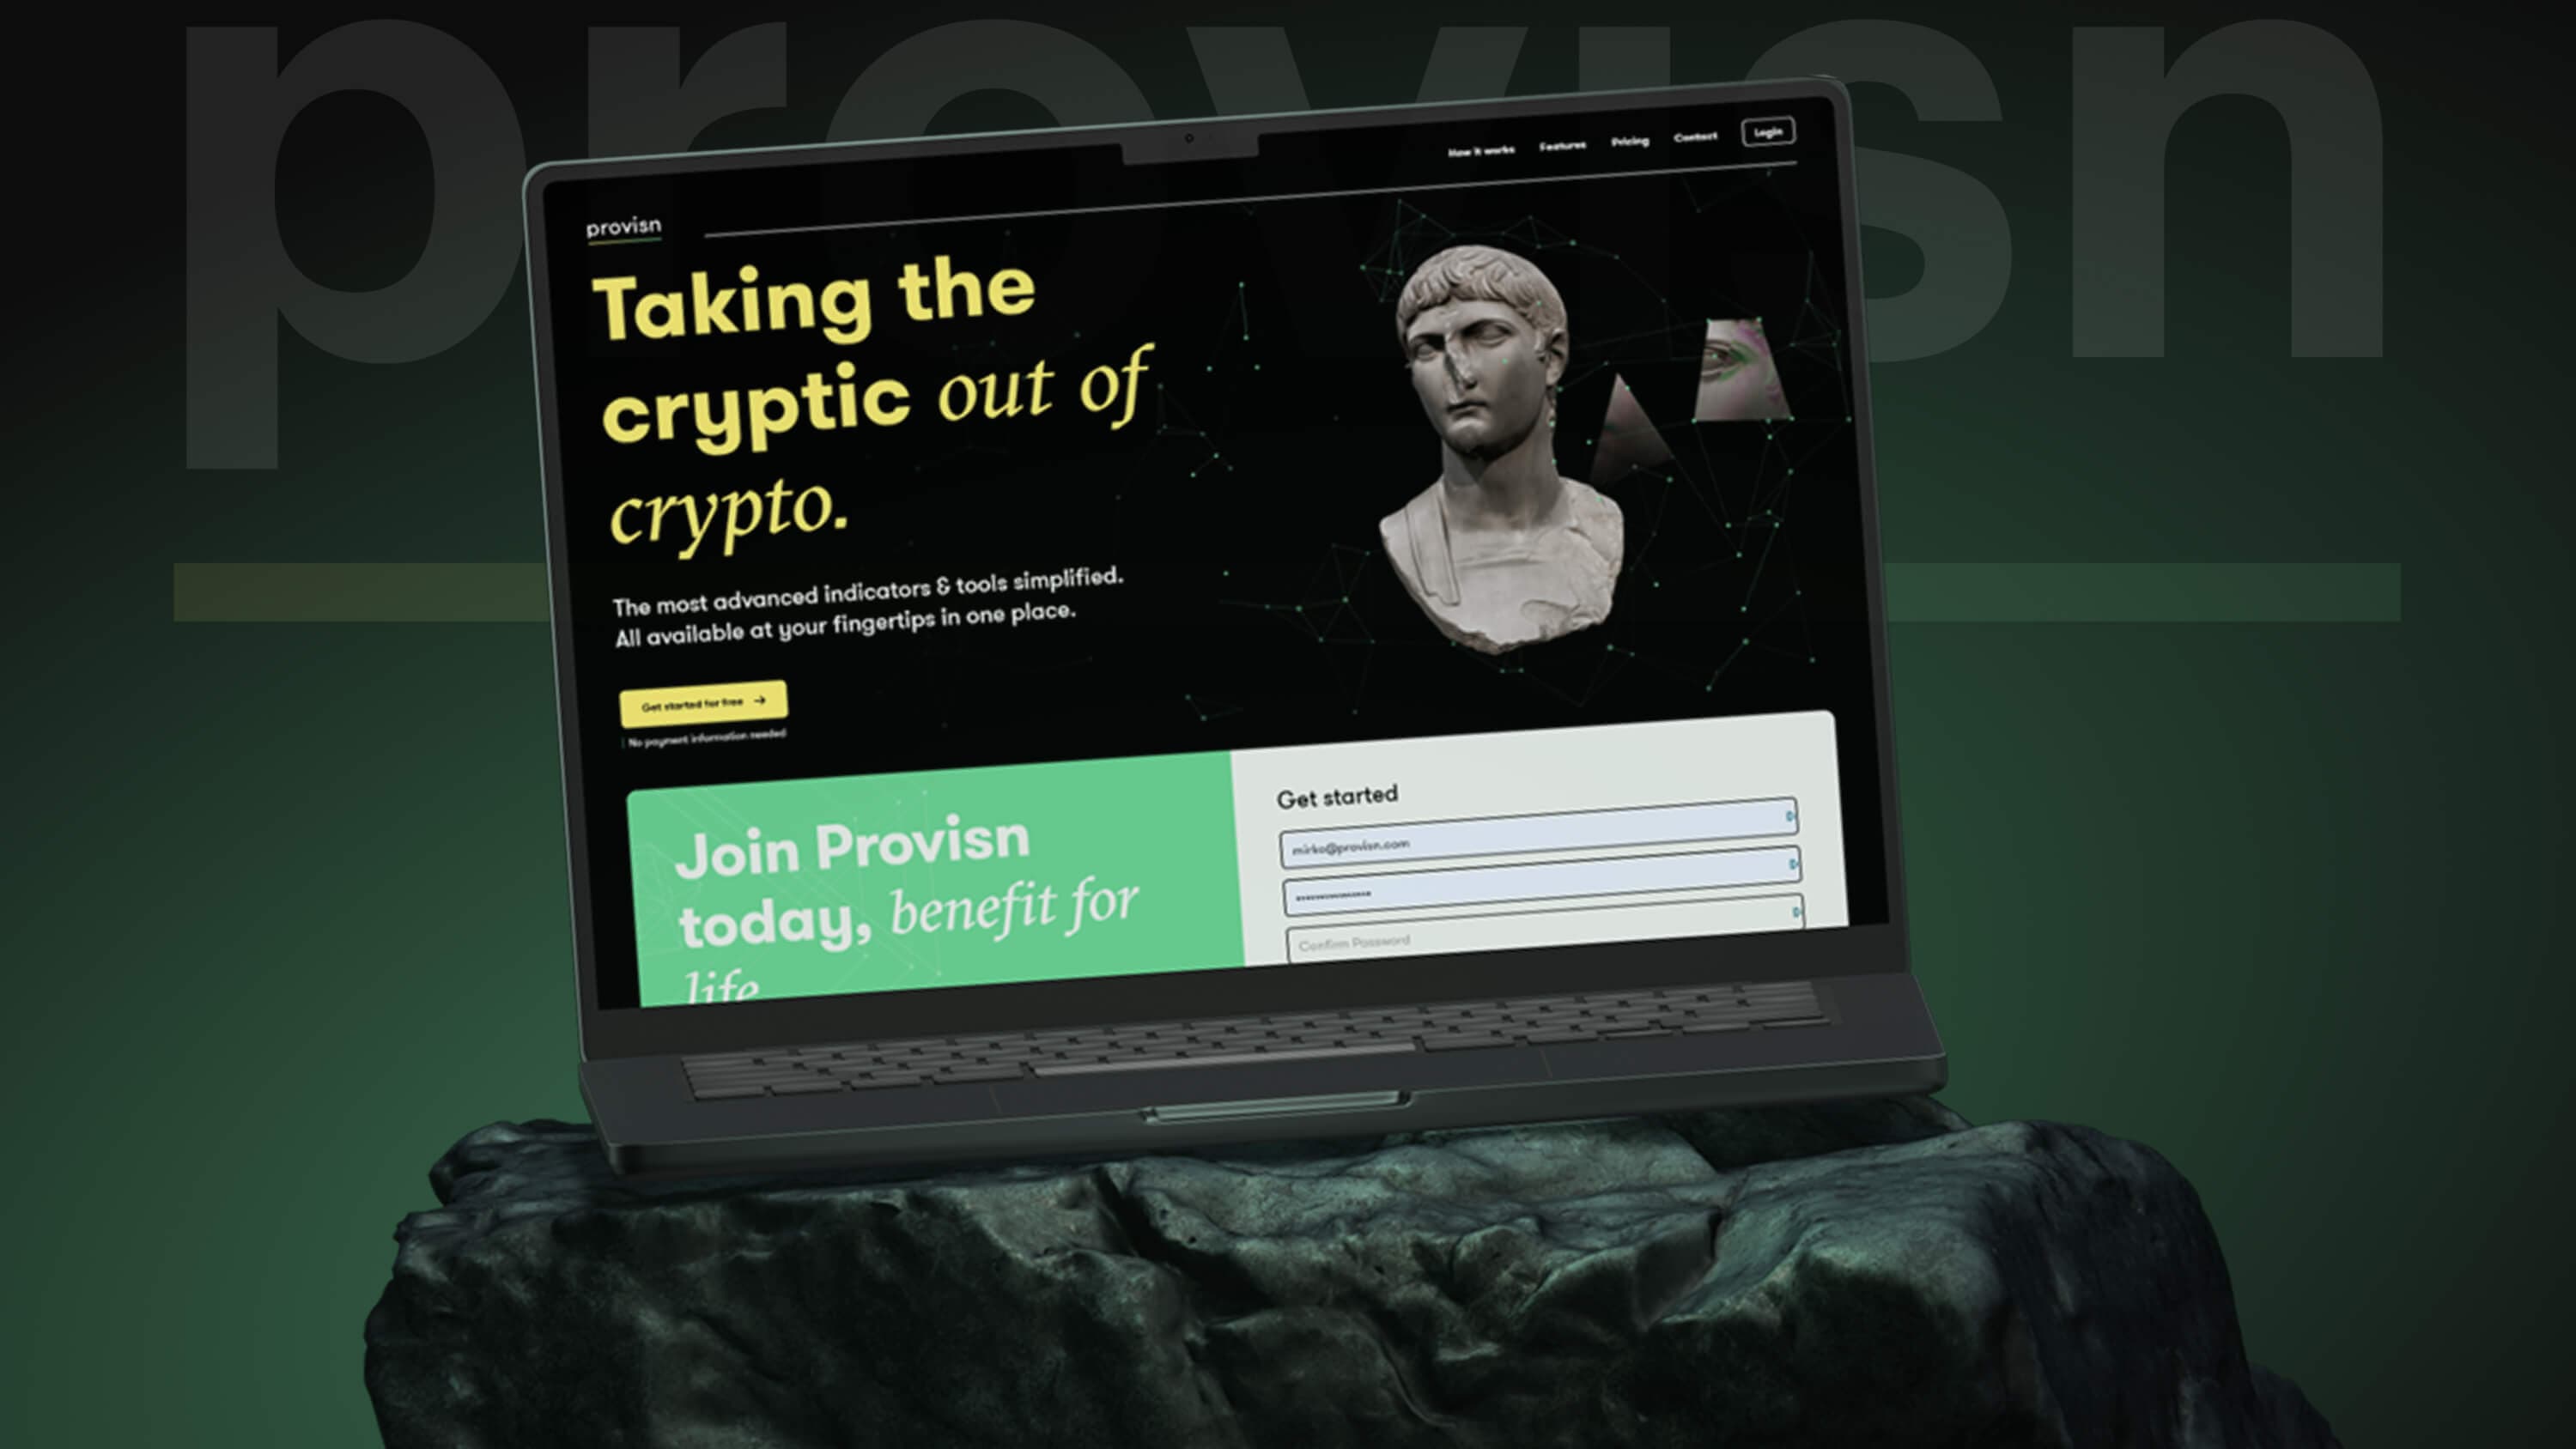
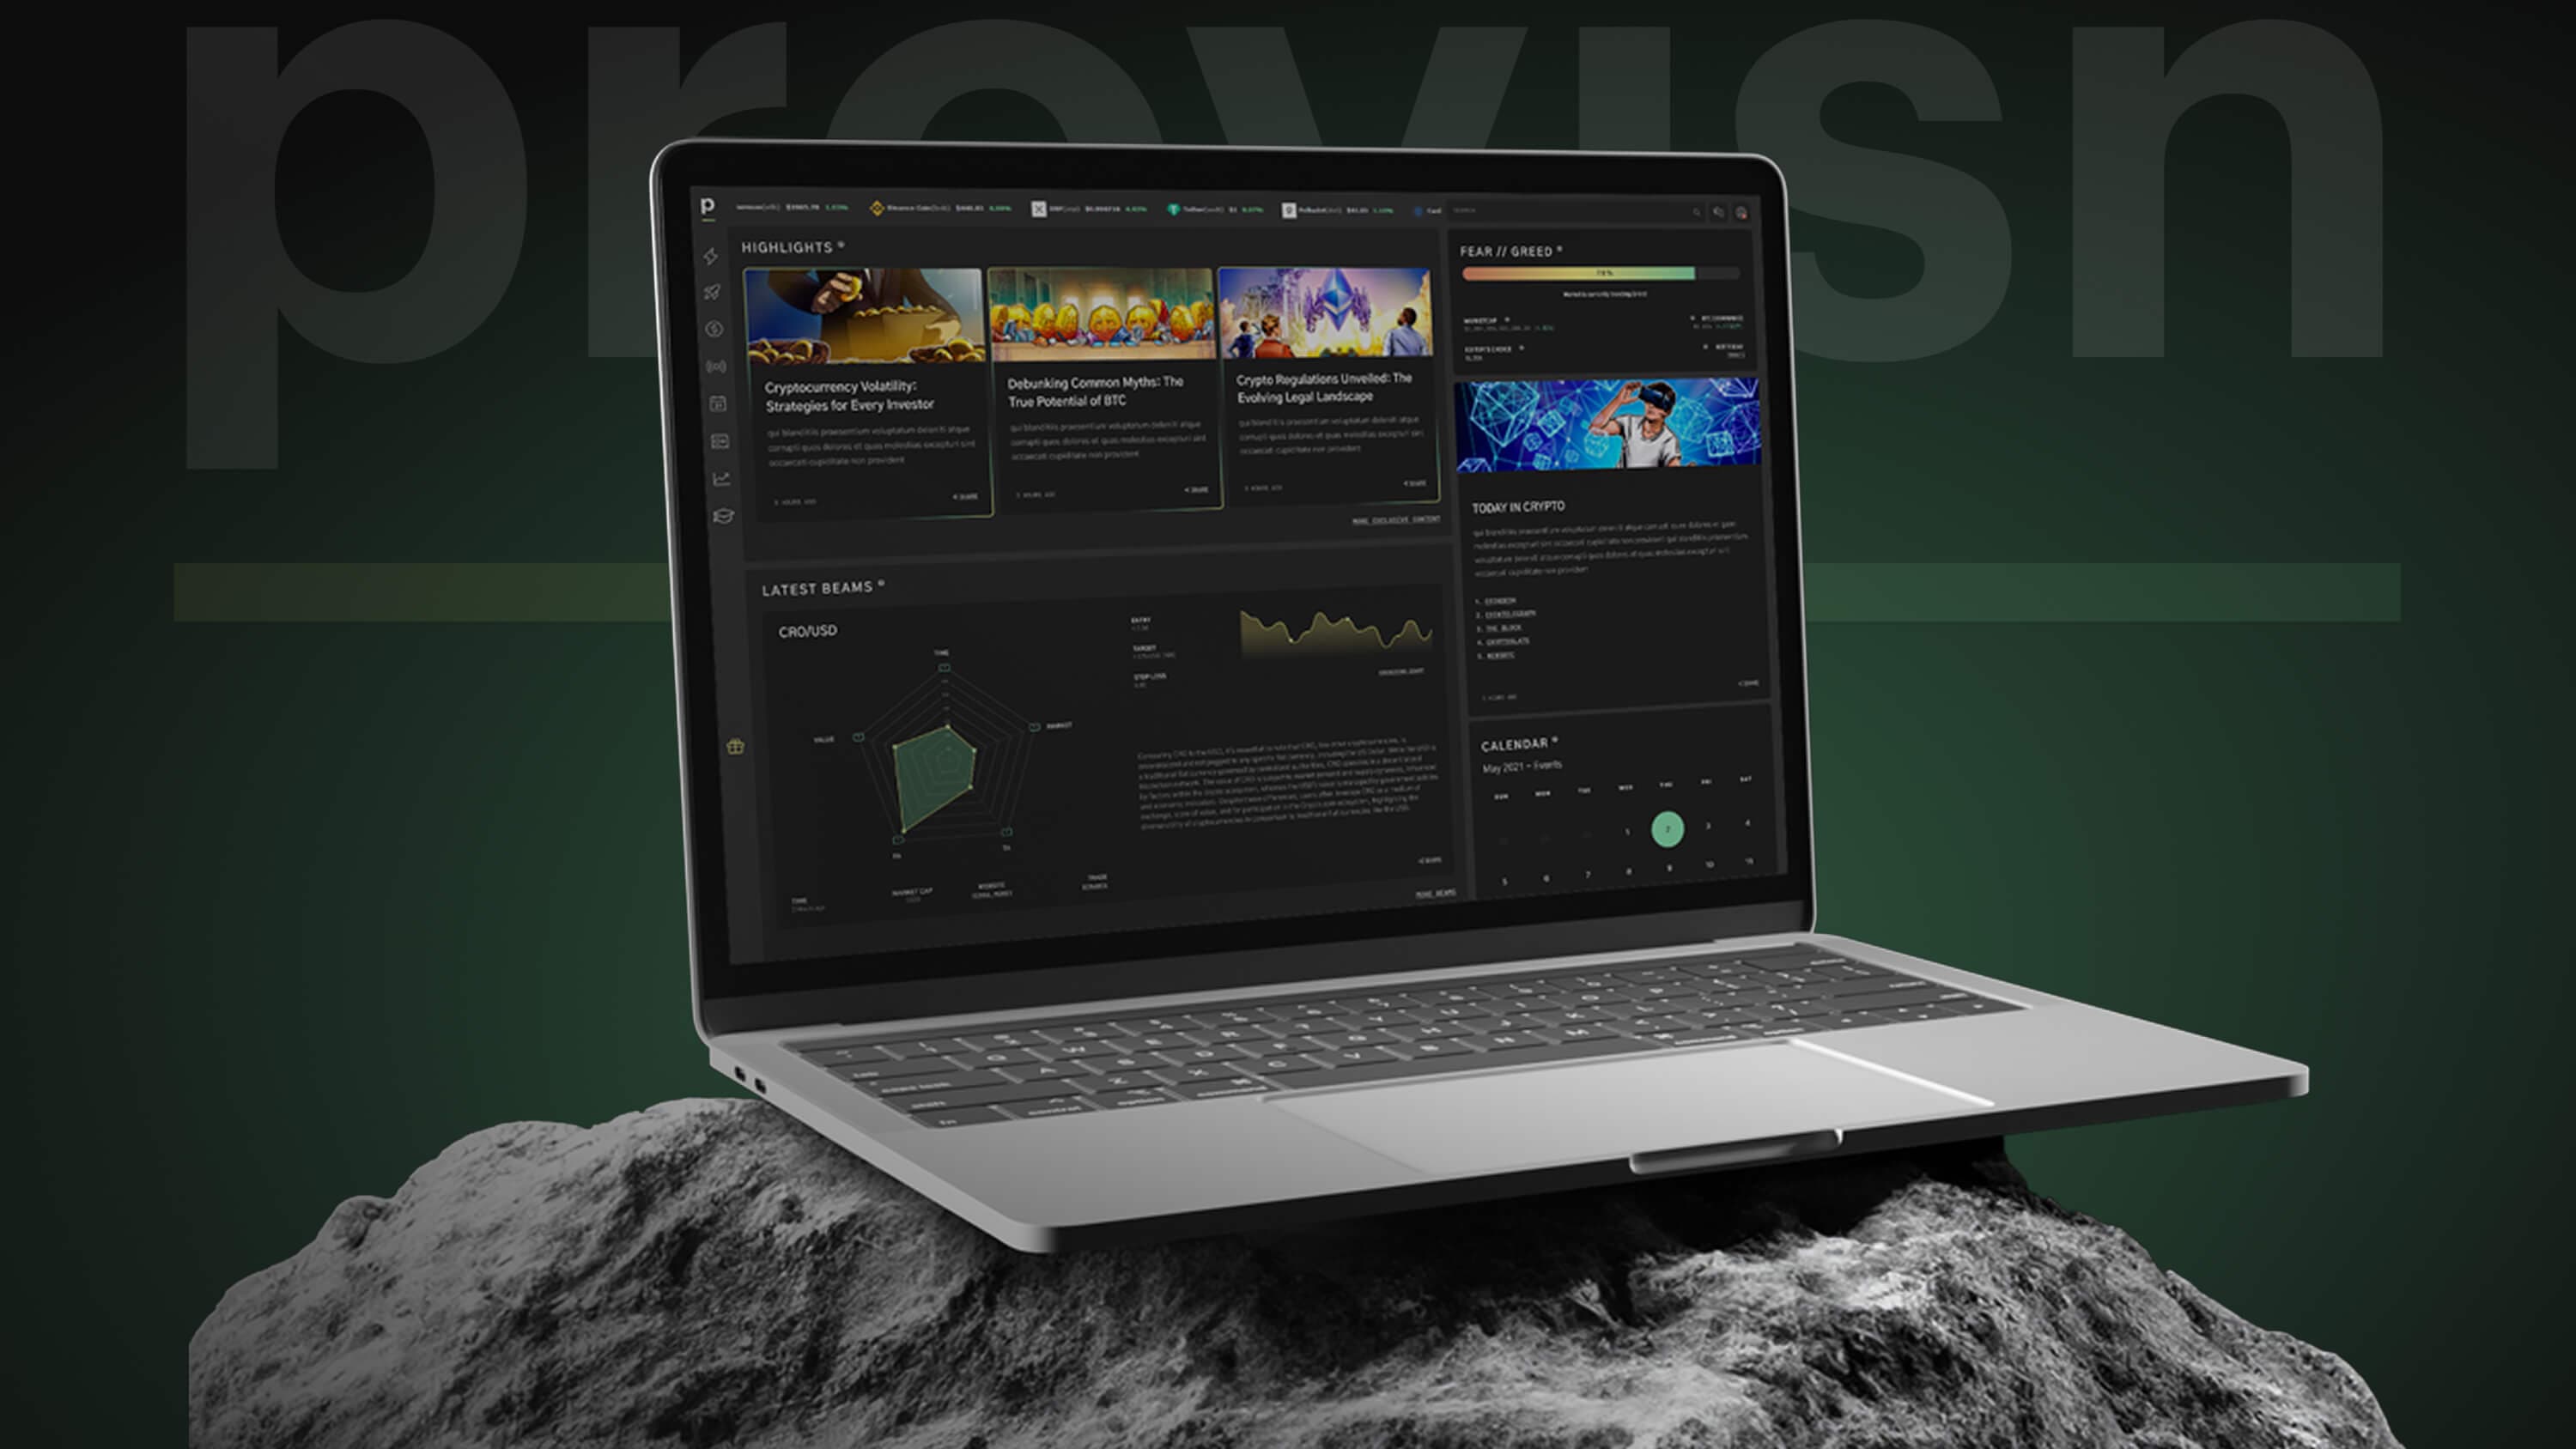
The brief was in Provisn's own promise: take the cryptic out of crypto. I was the only designer on the team, so I got to follow that idea all the way, from the brand and the website to this dashboard.
User research across our user base revealed two groups with very different needs: alpha users and newcomers.
Alpha users
The most experienced users focused on a few key metrics, such as market cap and technical analysis, and knew exactly what they were looking for.
Newcomers
The rest of the user base was close to new to crypto and wanted guidance. Rather than designing for one group at the expense of the other, I identified what they had in common: daily news, events and talks, and token spotlights. That shared ground became the core of the dashboard.
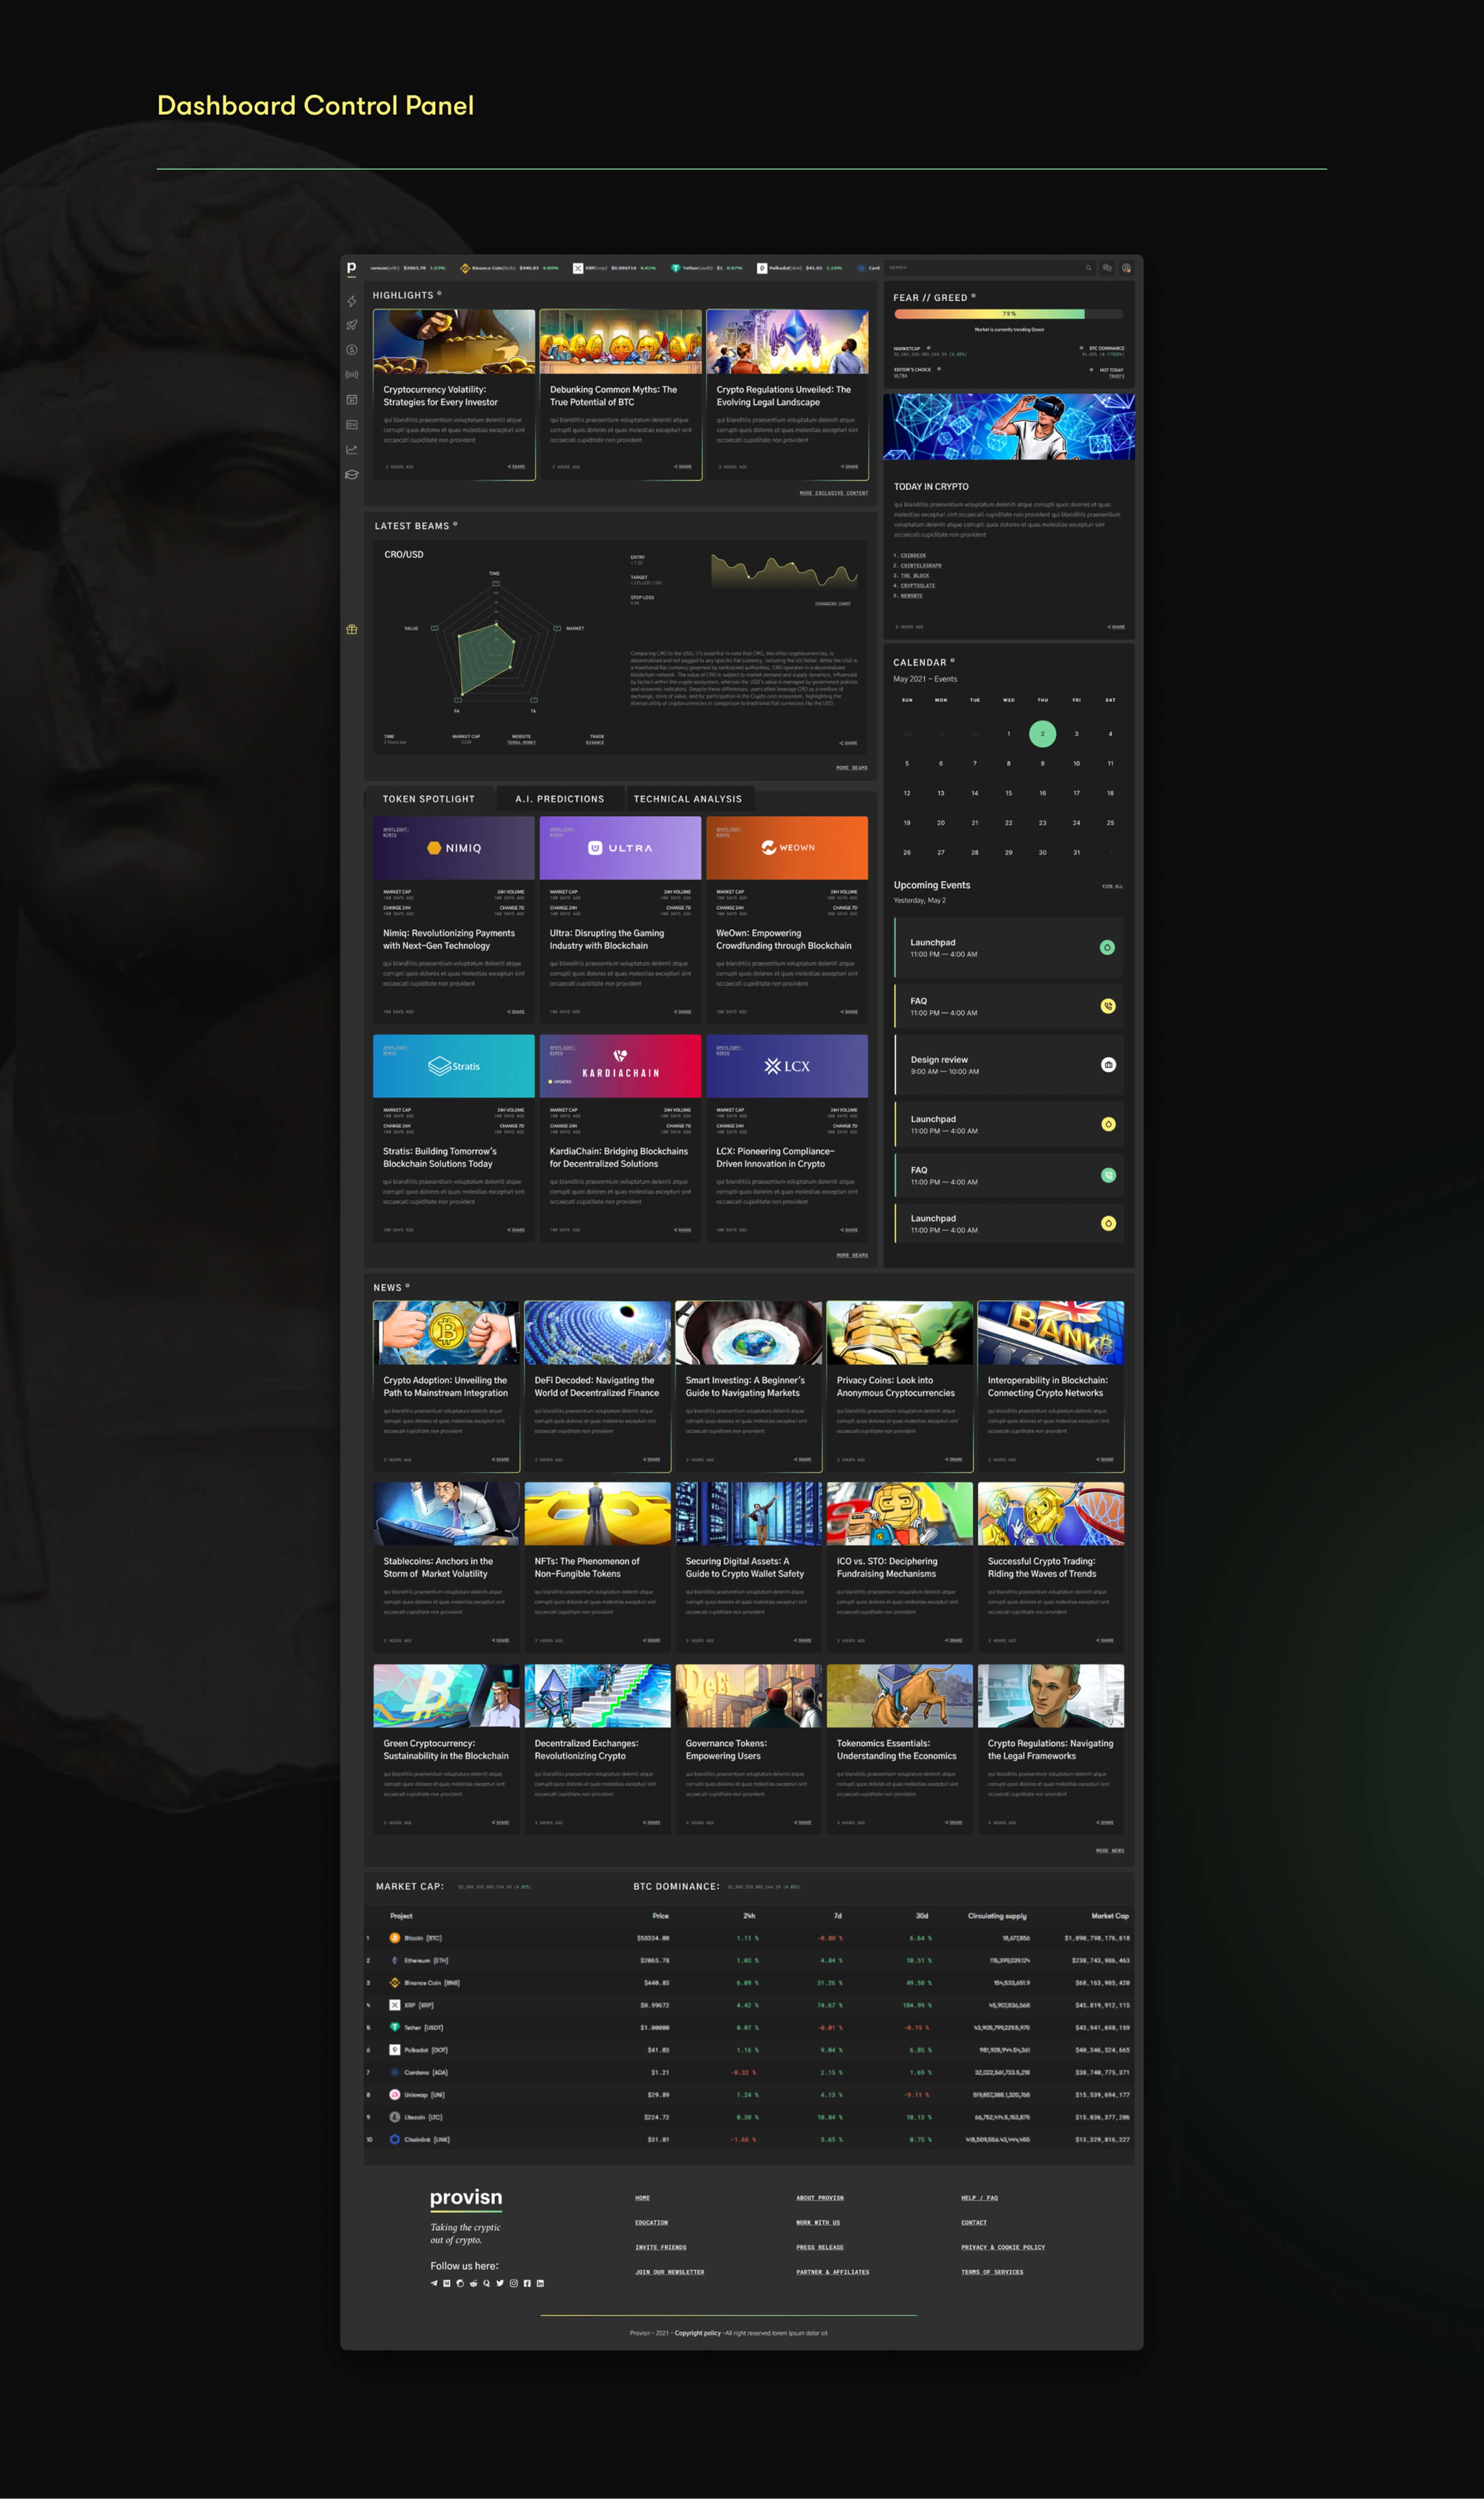
The home page is structured by how often its content updates, from hourly to weekly.
The structure
Content that updates hourly or daily sits at the top, weekly content follows, and the market cap ranking, the most stable element, closes the page.
The rationale
This cascade puts the content both groups share first, guides newcomers through the day's key information and gives alpha users a predictable place to find their metrics.
A home page that keeps users up to date at a glance, and a personal area shaped by each user.
The home page
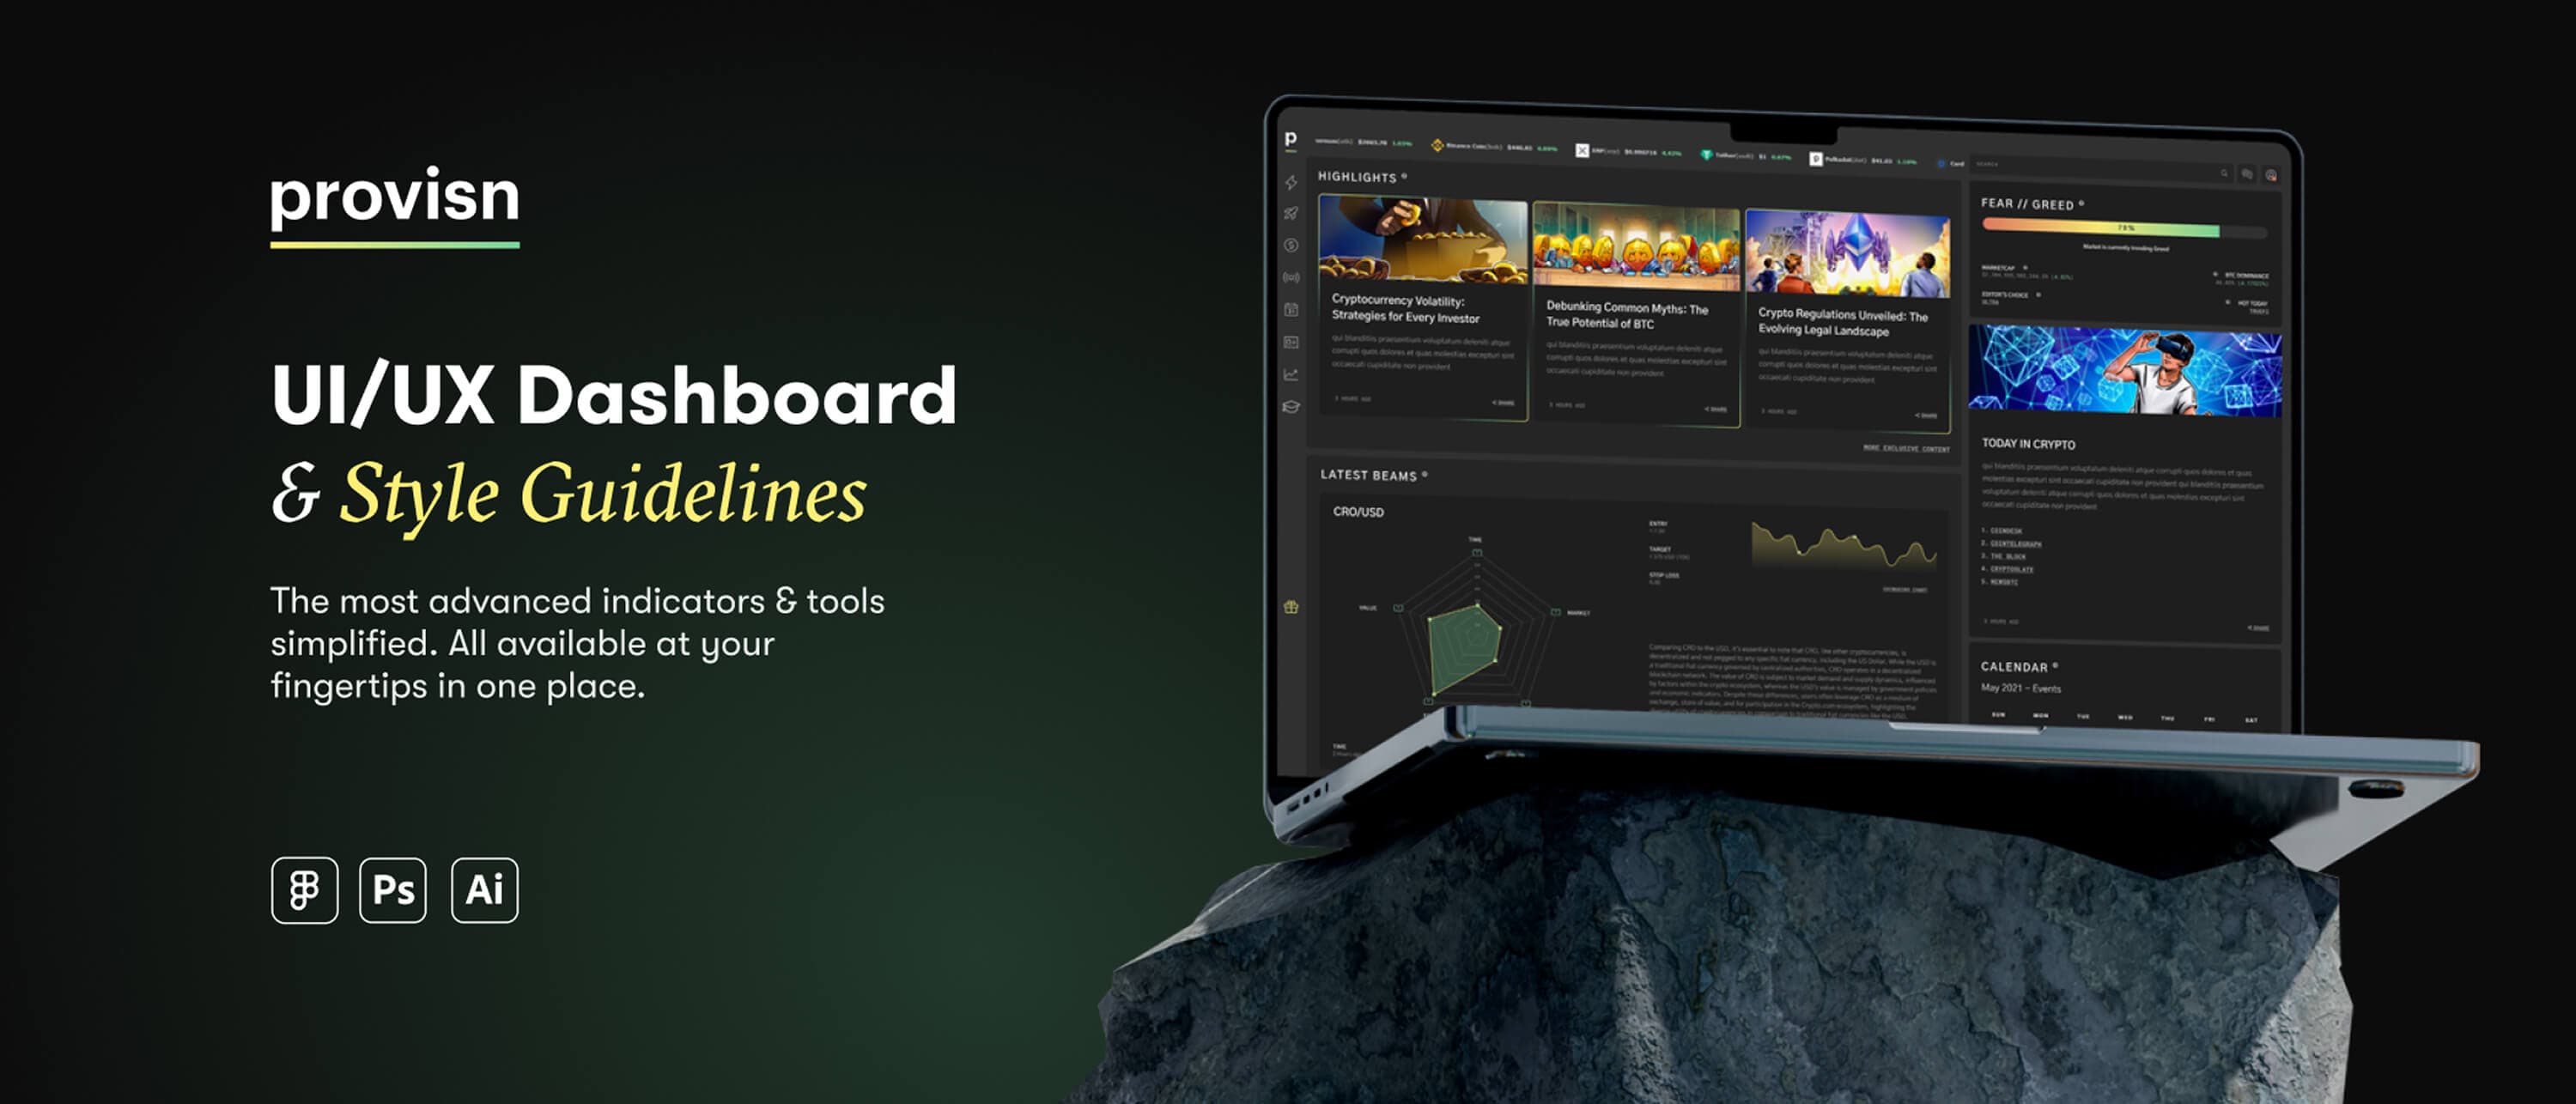
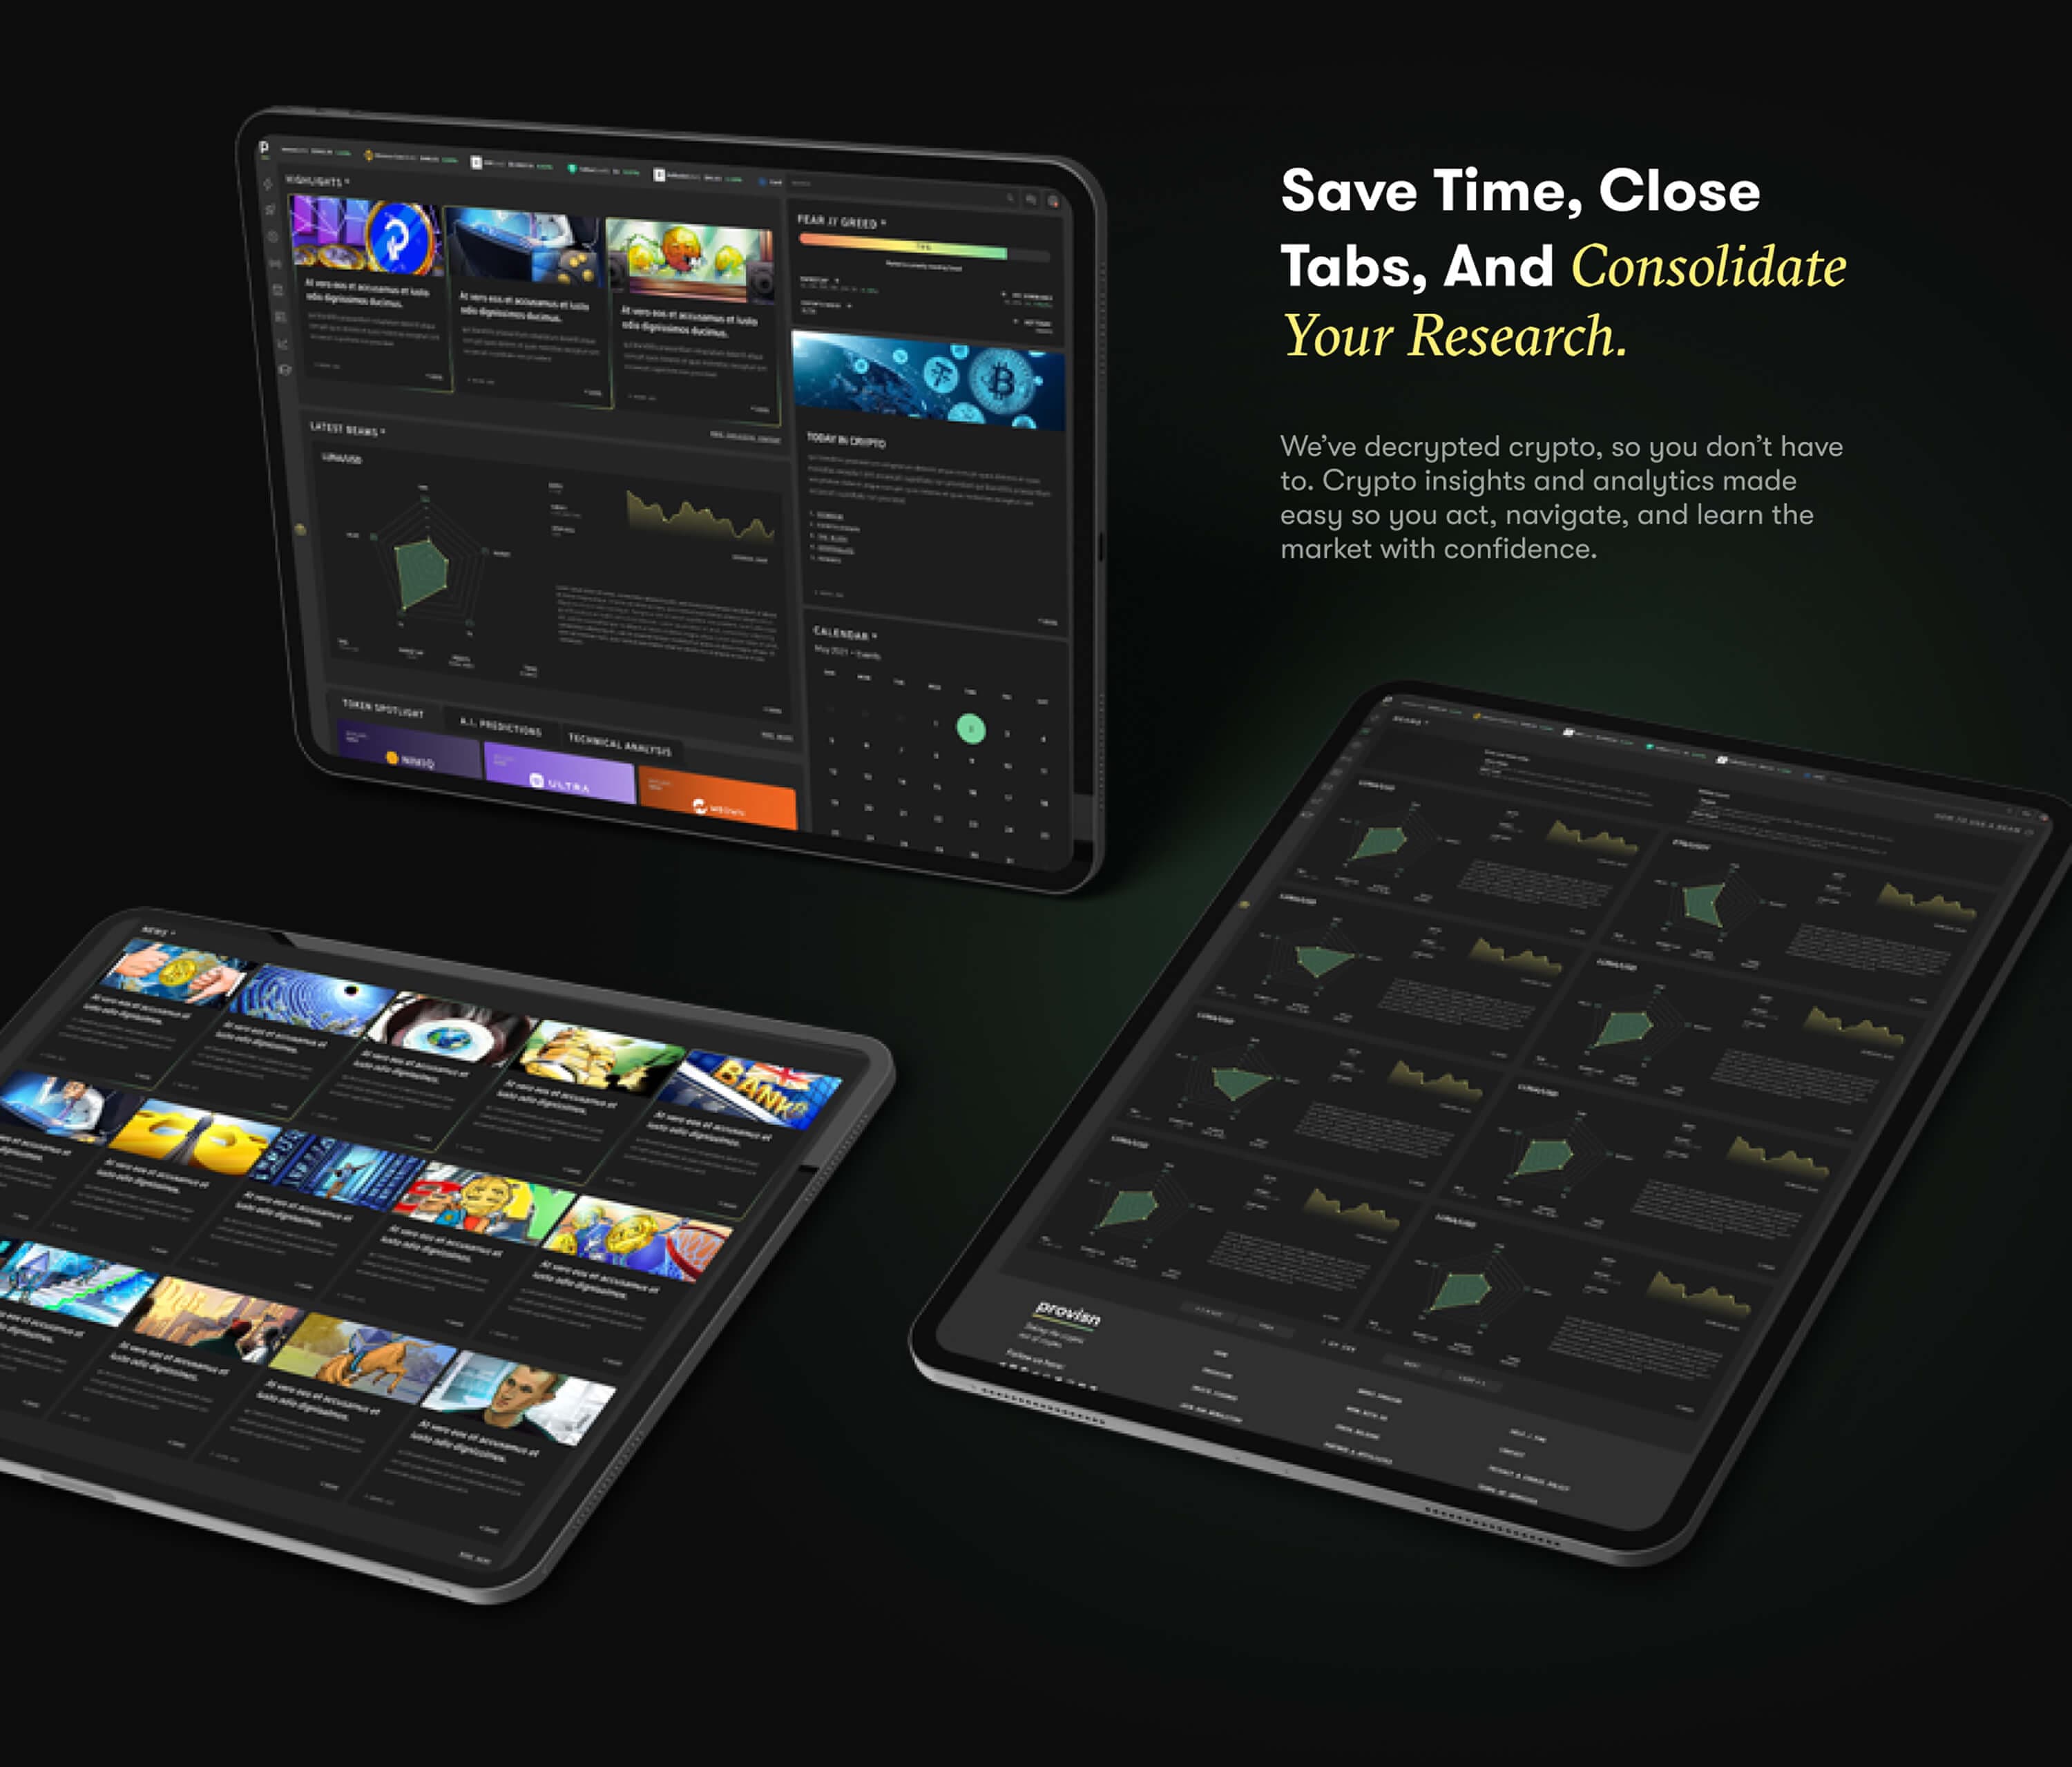
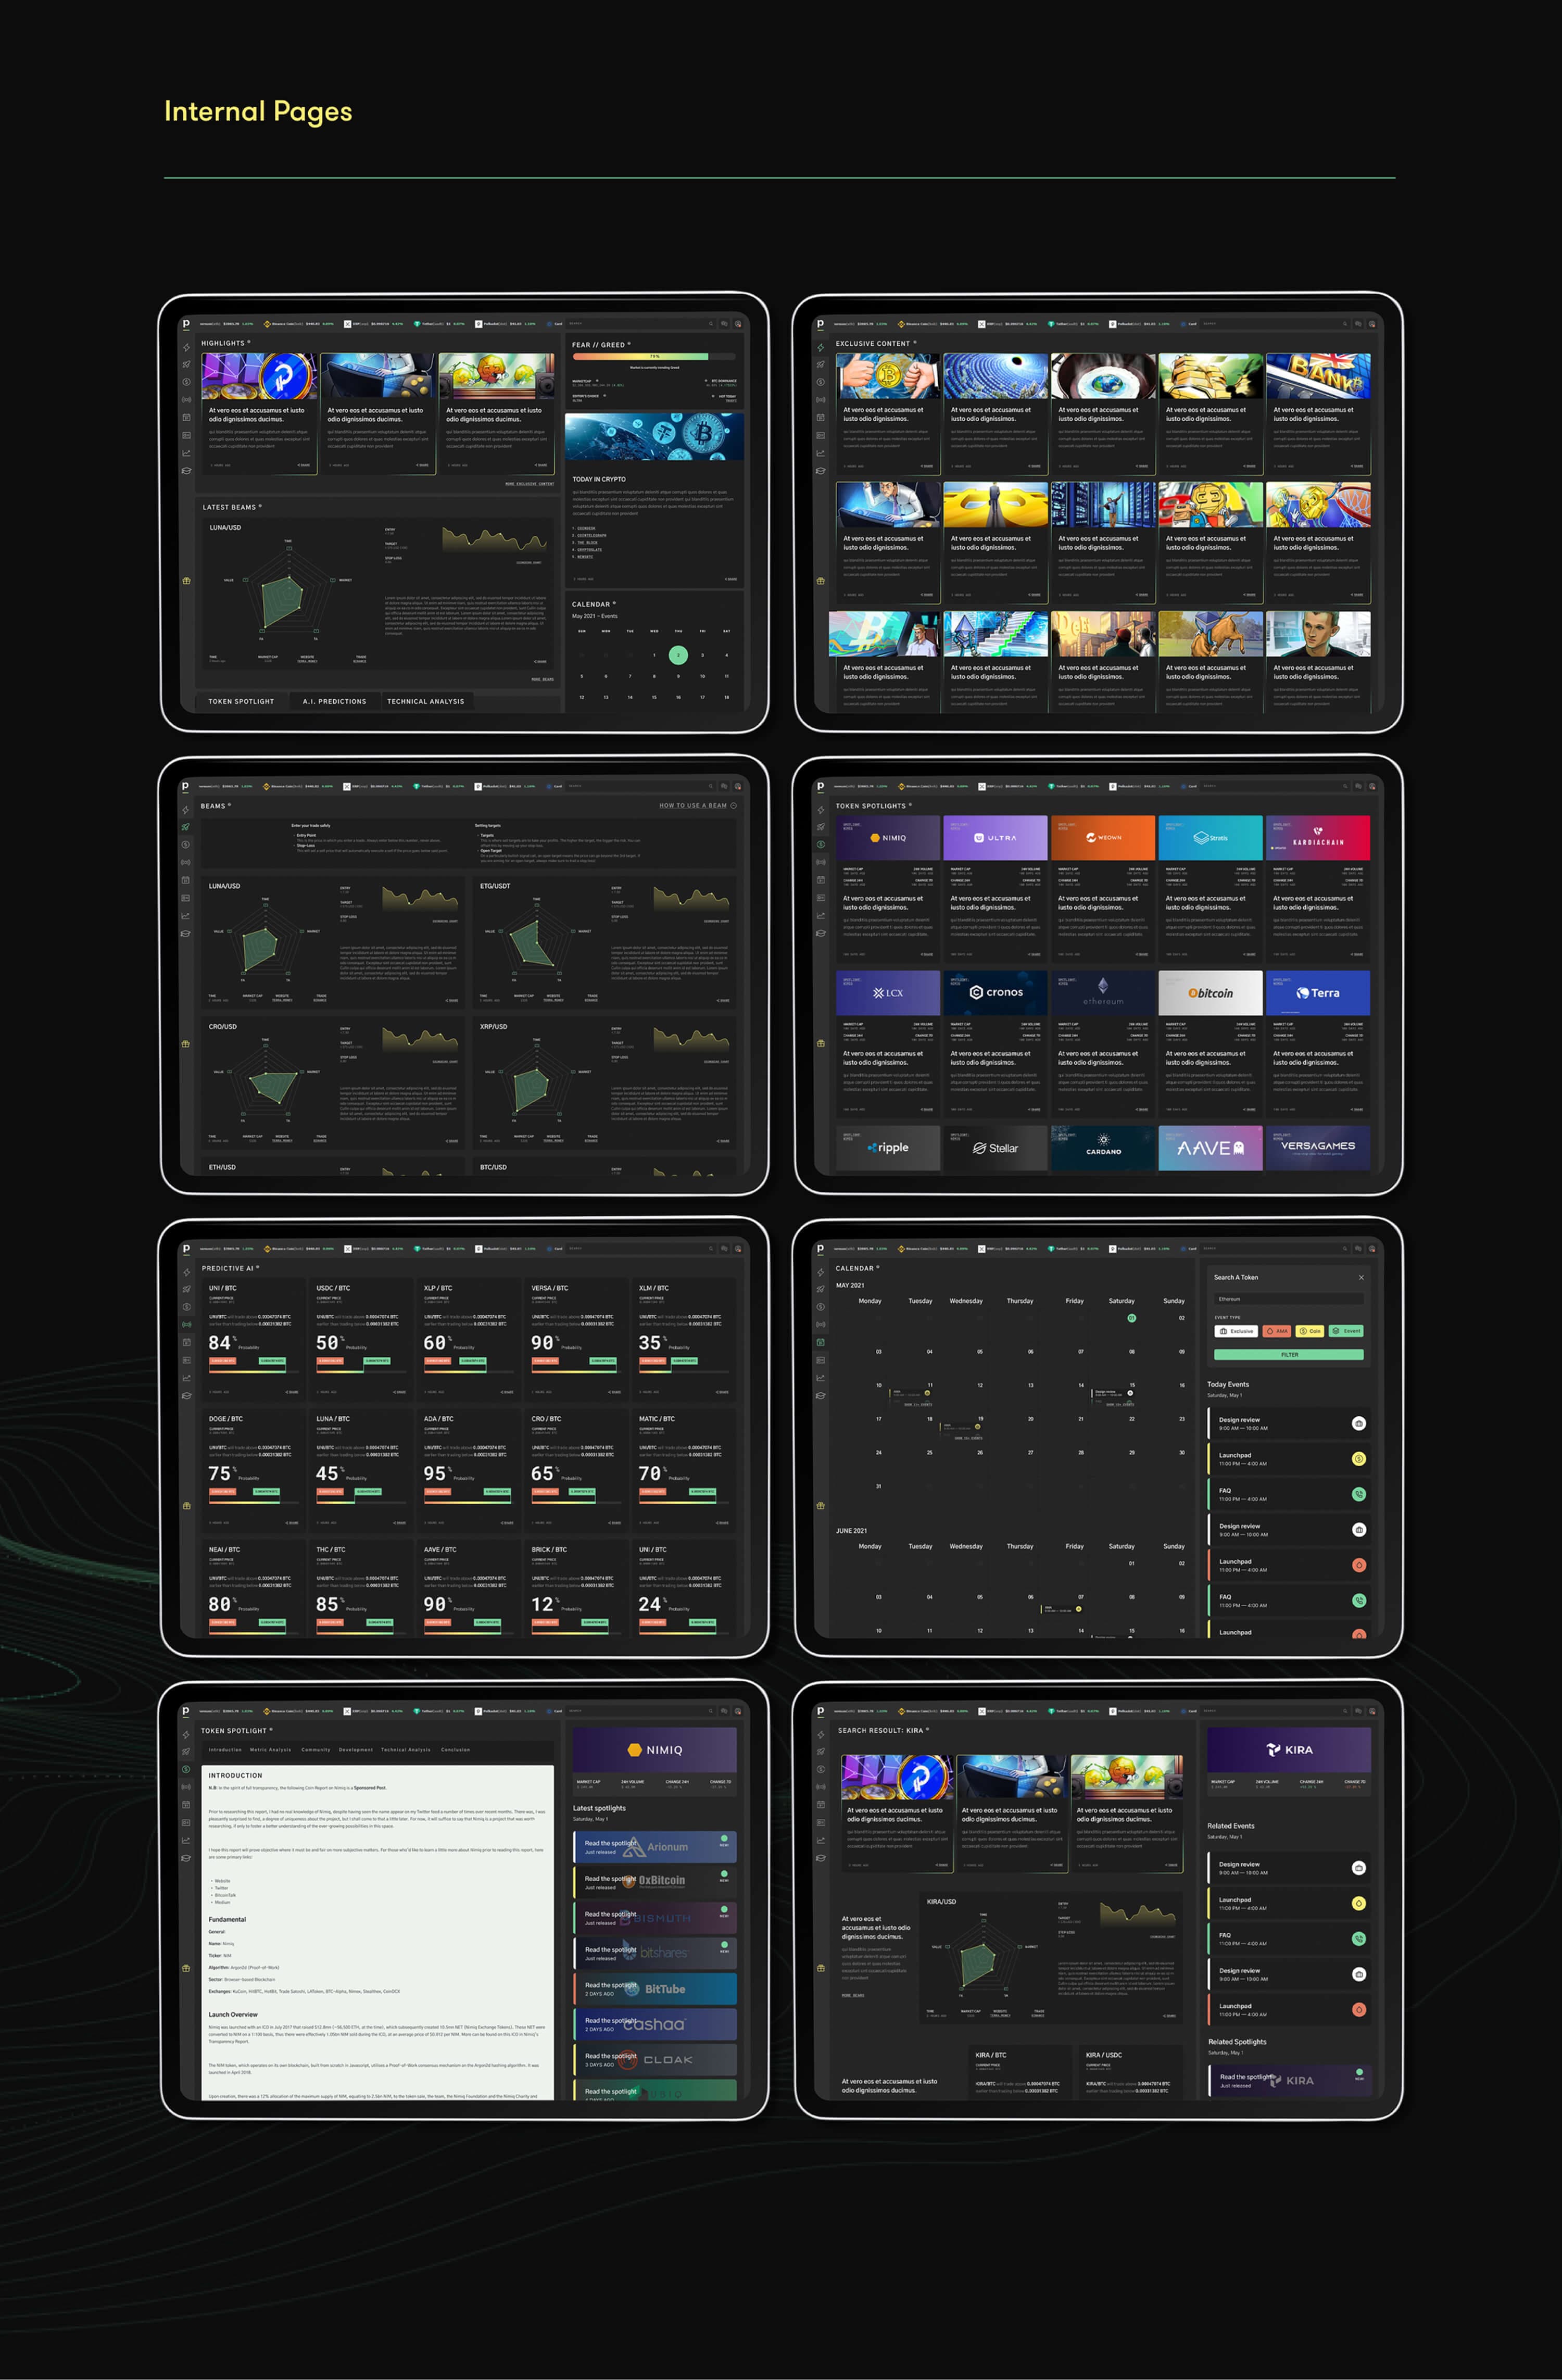
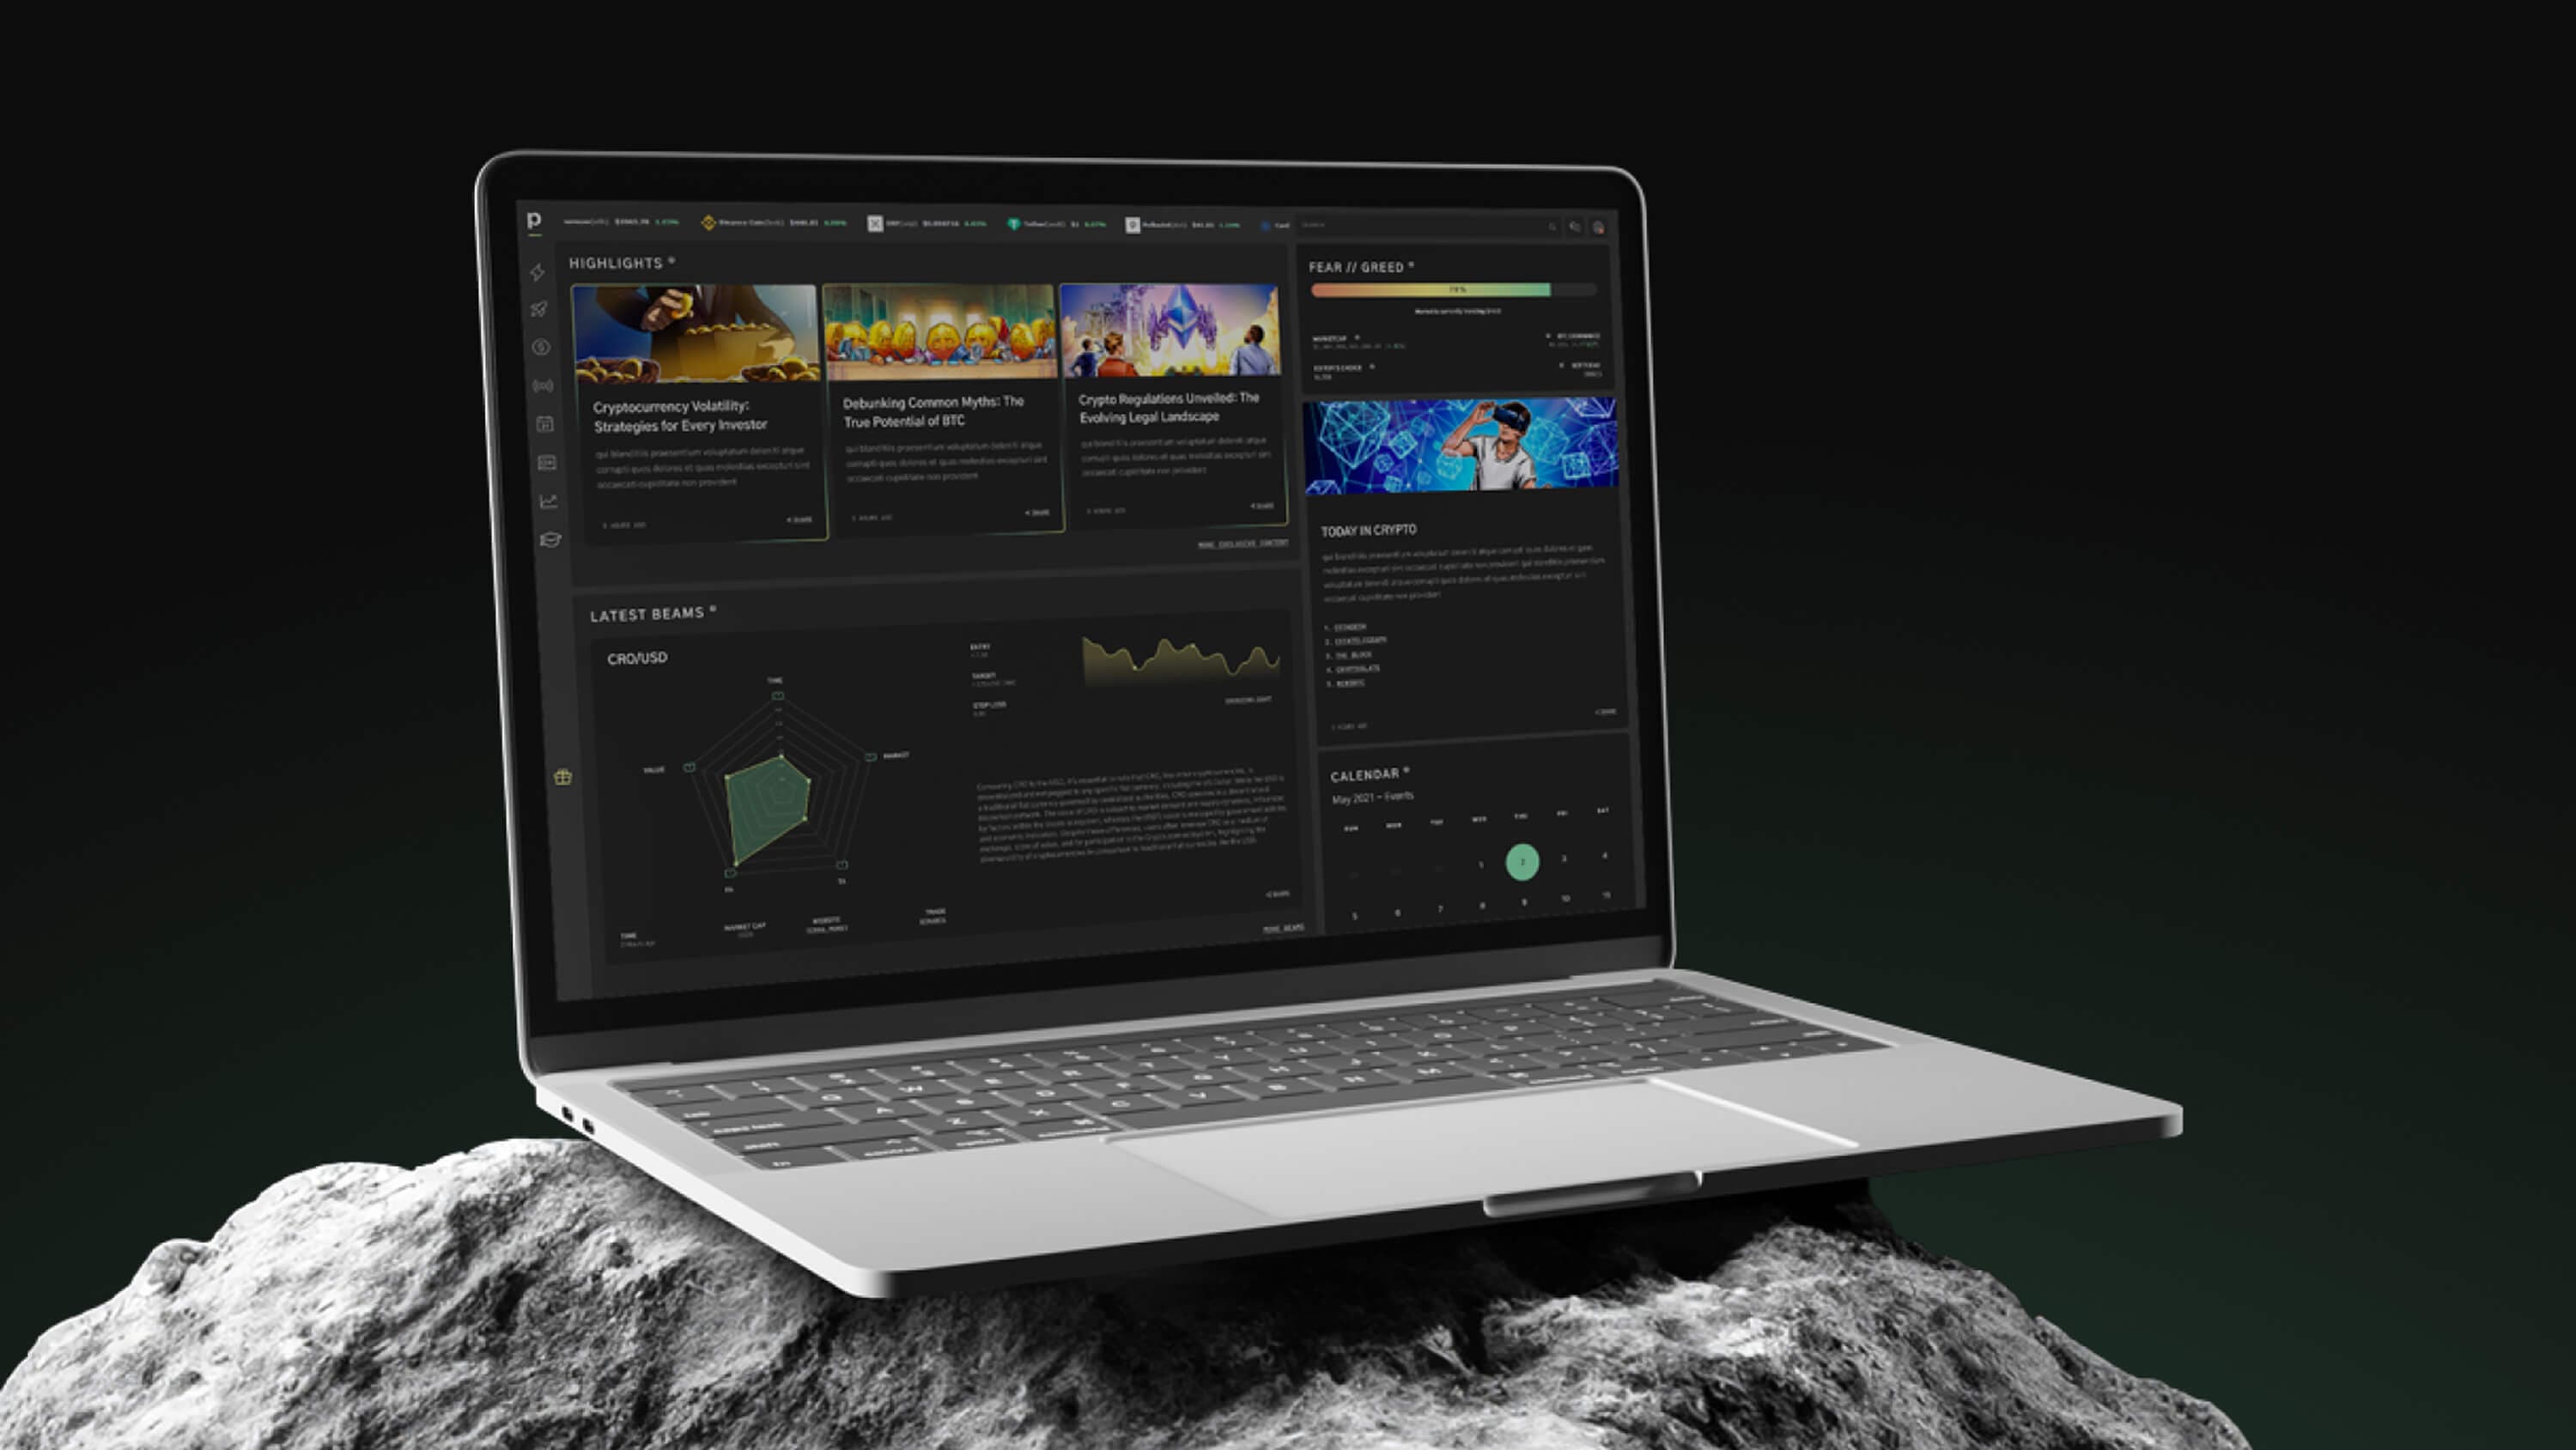
Curated daily news, the fear and greed index, a summary of the day in crypto, a token breakdown with a live chart, upcoming events and talks, and the market cap ranking, designed so users can get up to speed in a few minutes.
The personal area
Each user has a private area with the tokens and predictions they follow, an events calendar to read about and join sessions, and Crypto School, where they choose what to learn next.
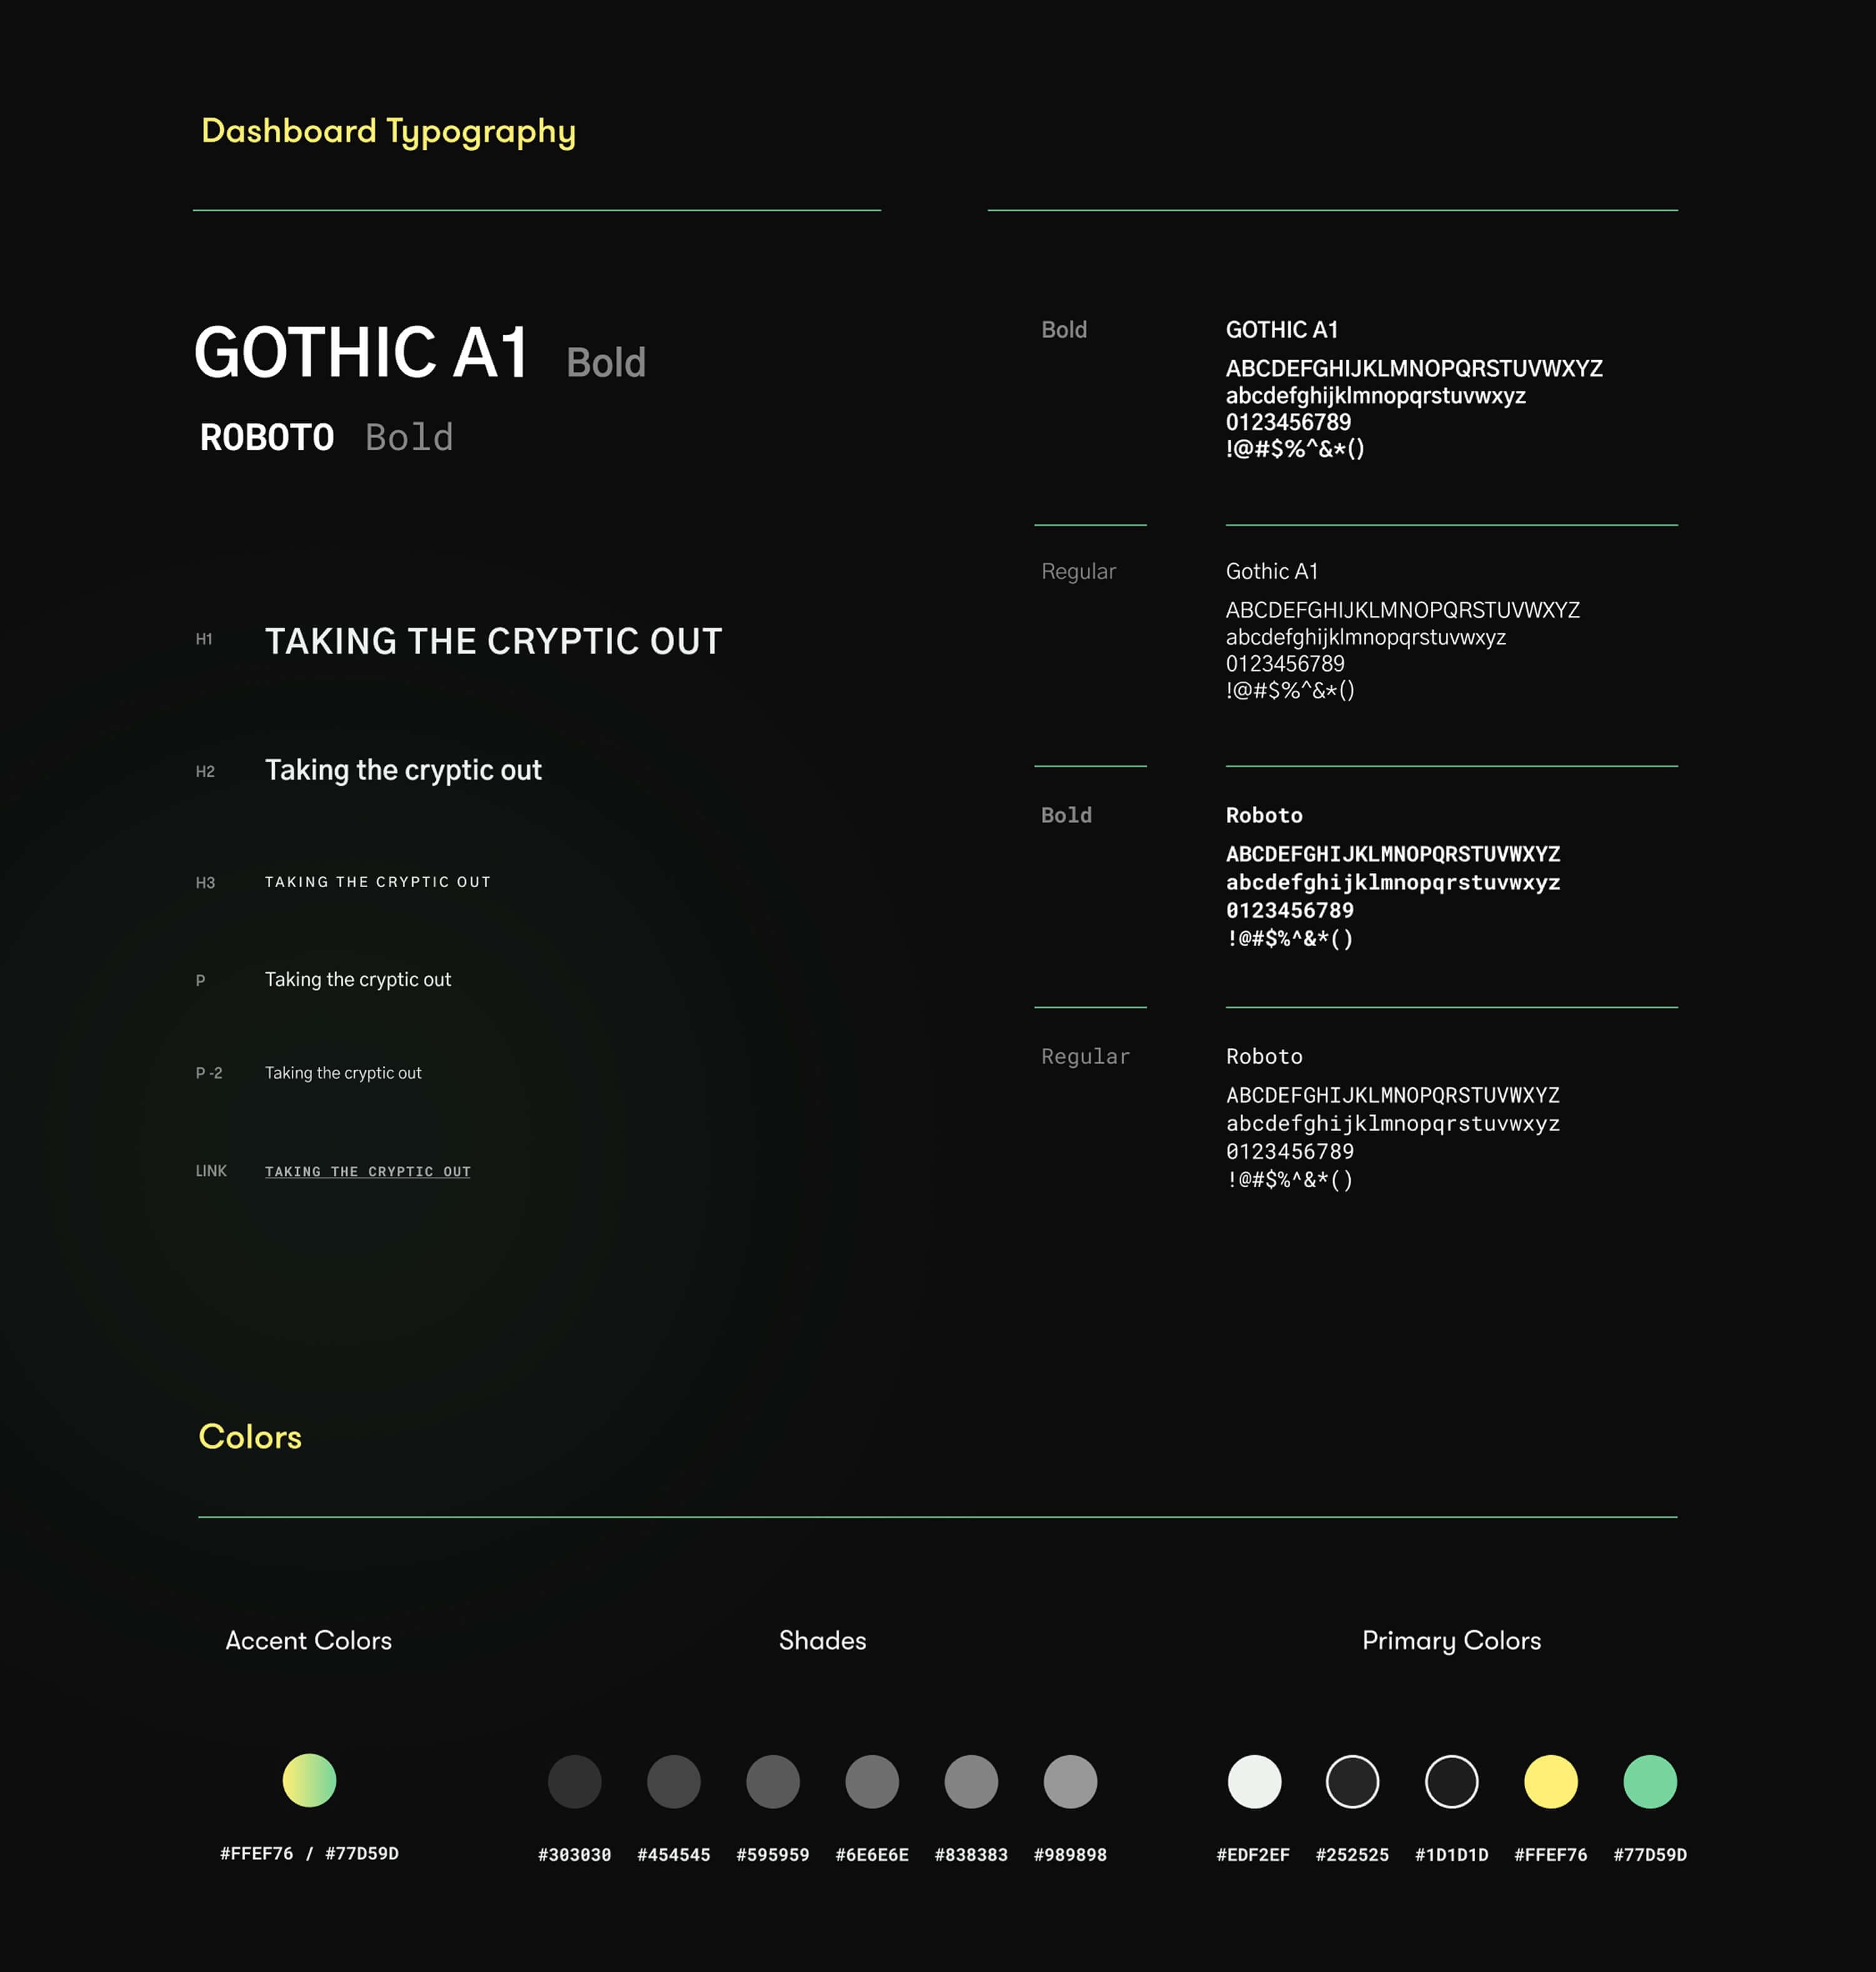
The dashboard extended the design system created for the brand and the website, and I followed it into the front end.
The system
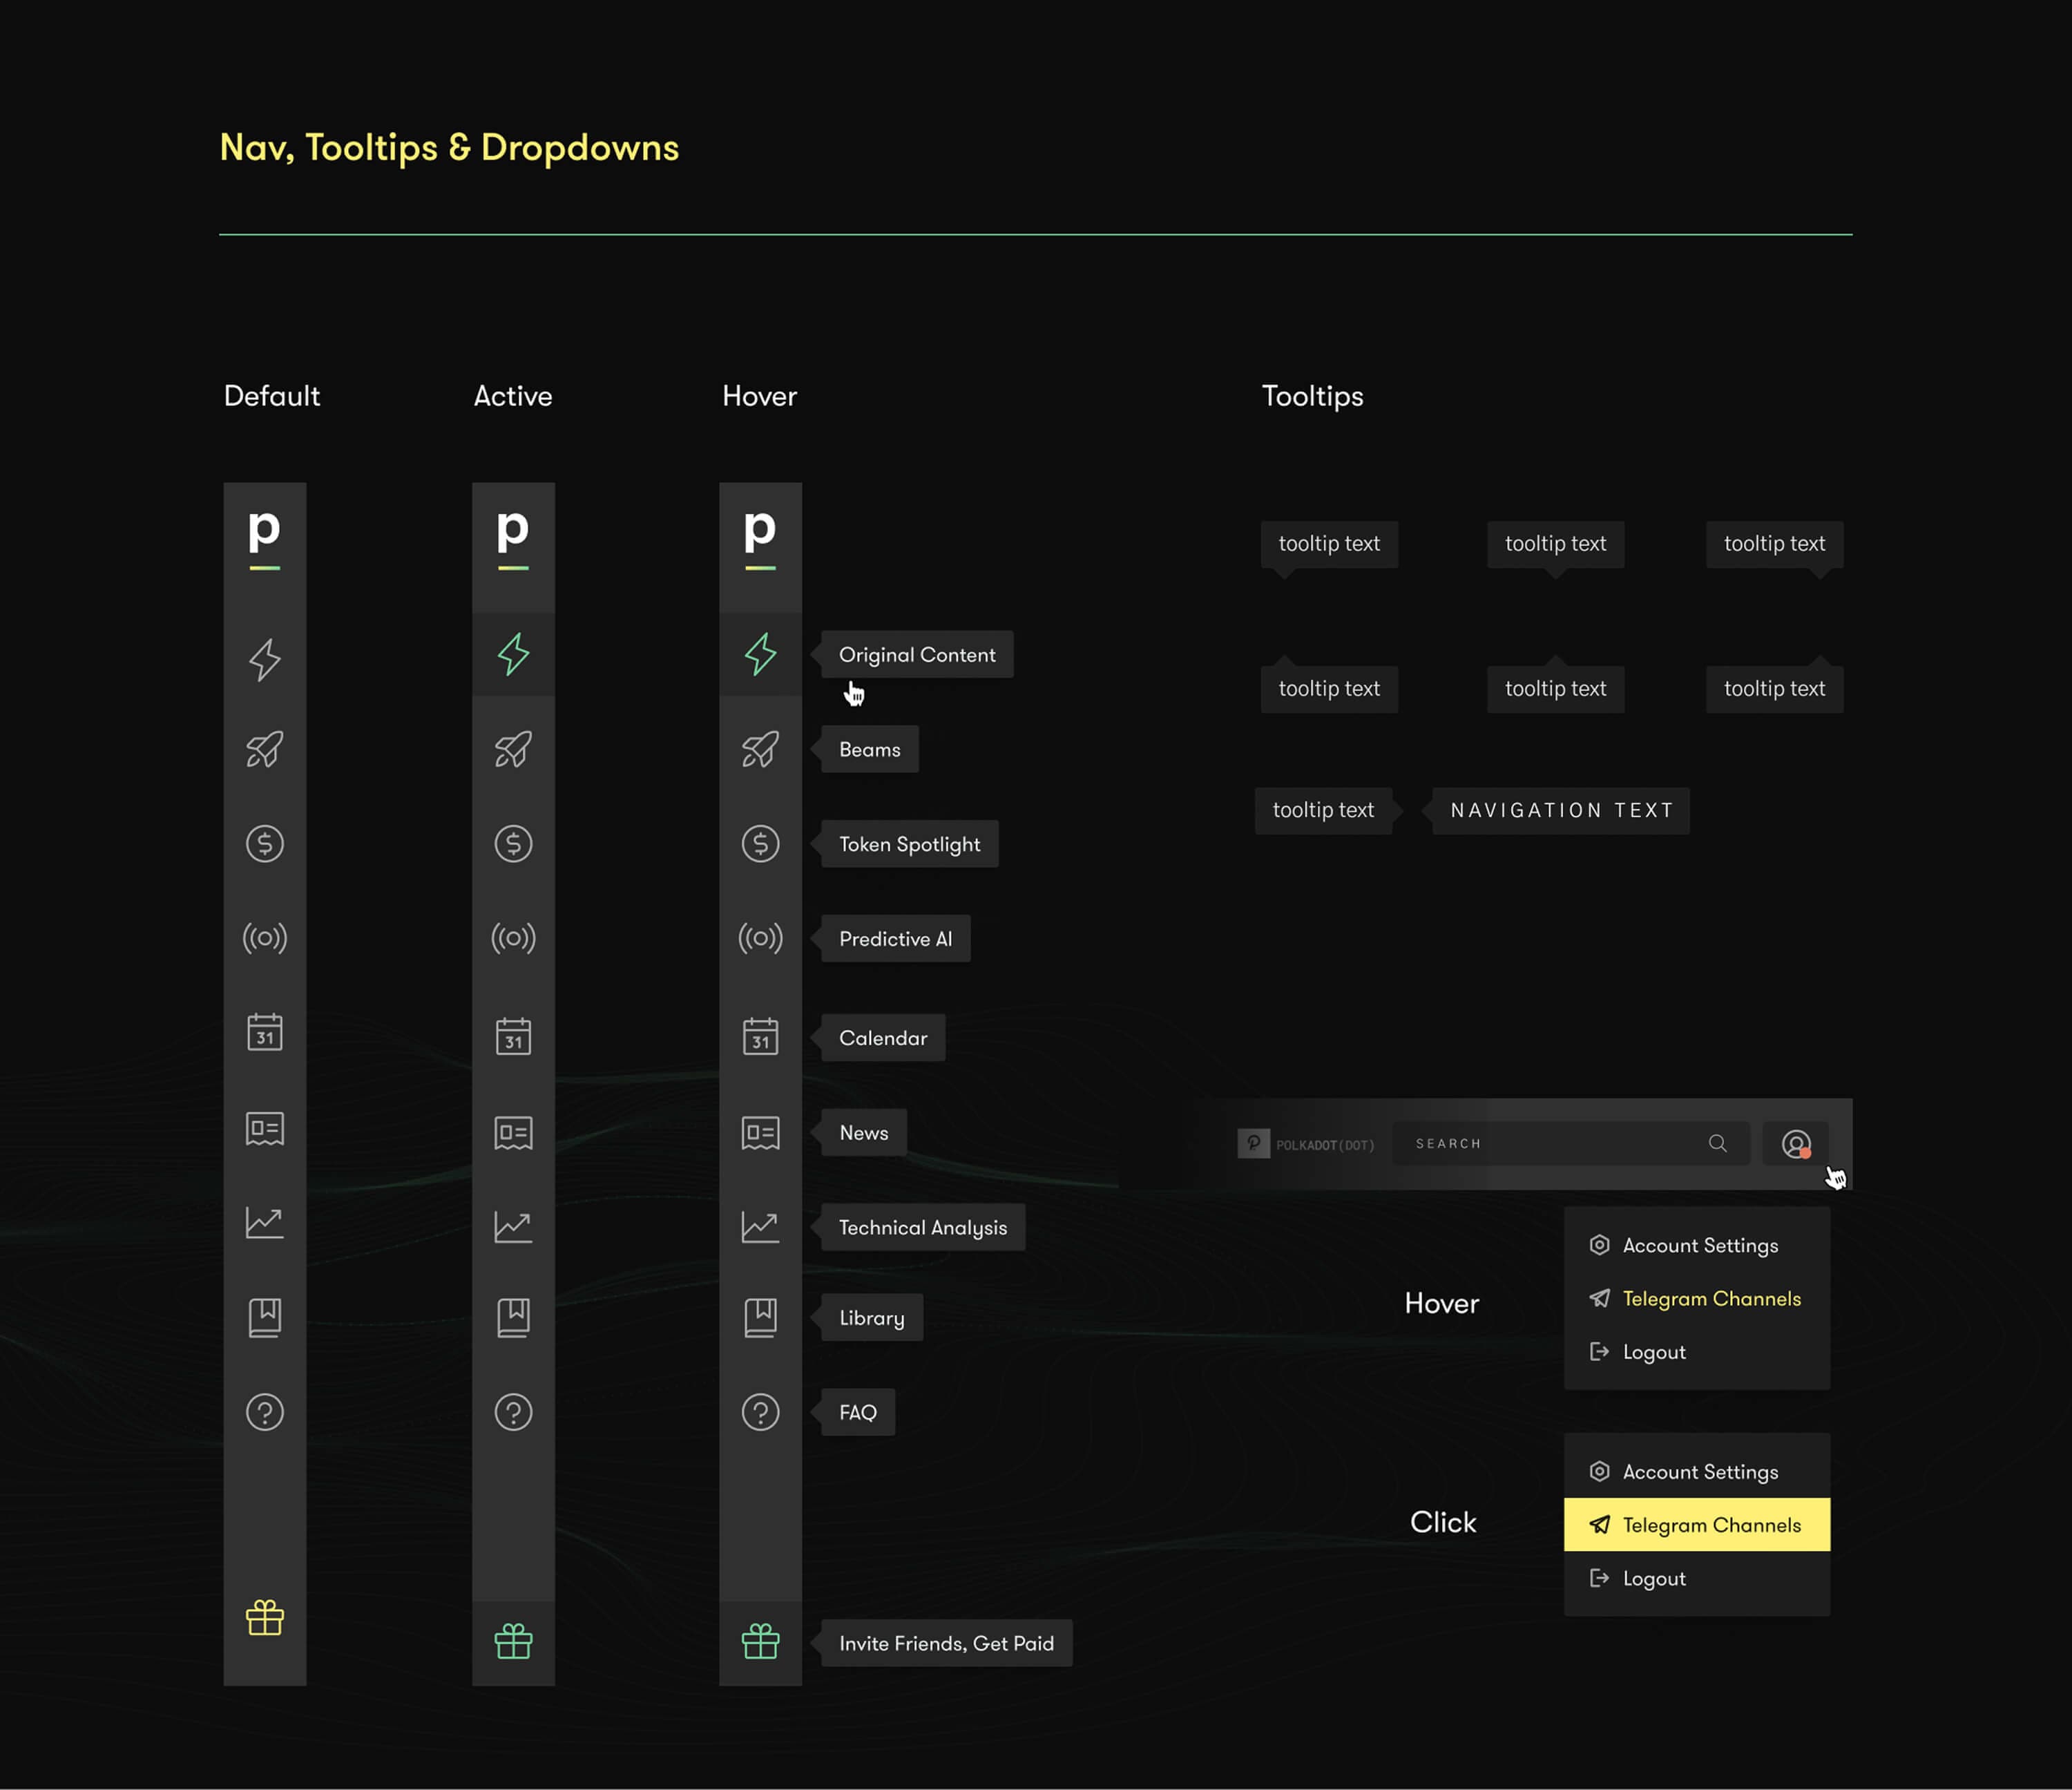
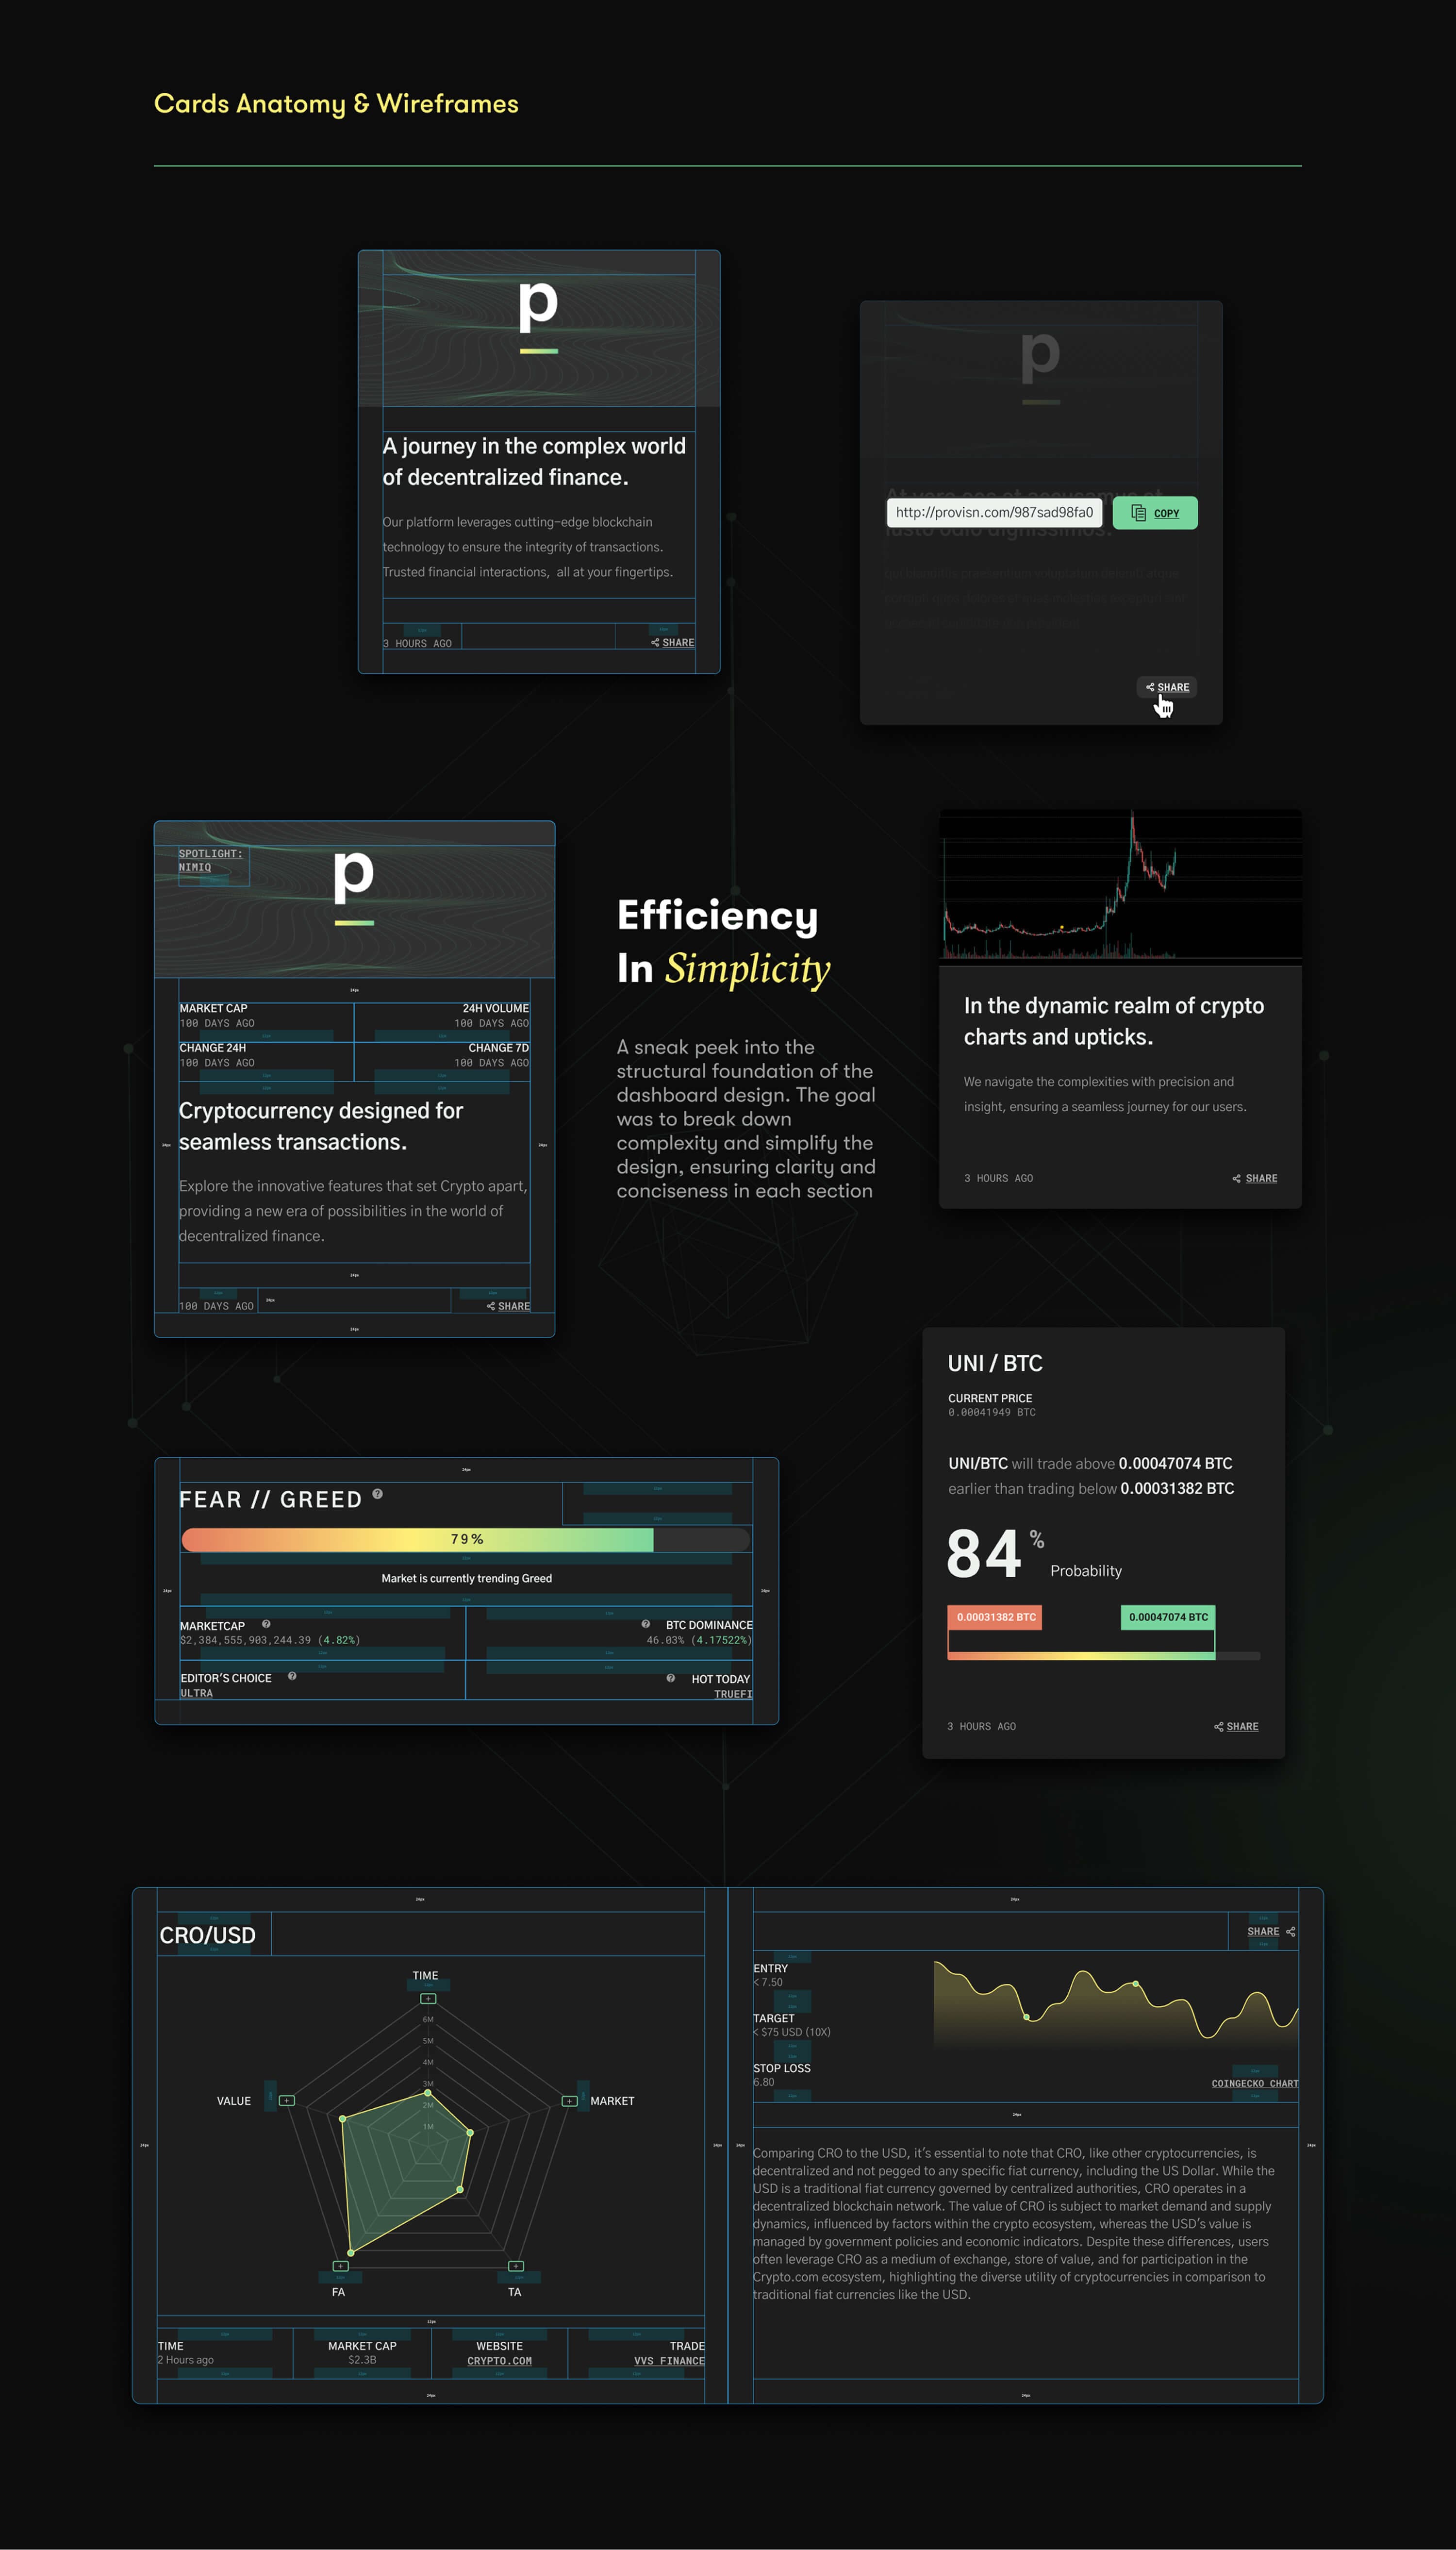
Building on the design system I had created for the website, I extended it with the components a data product needs: navigation, tooltips, dropdowns and a card system for every content type.
Design and code
As the only designer, I worked closely with the front-end developers and wrote part of the CSS myself, reducing friction between design and engineering and making sure the details that drive readability survived implementation.